How to analyze crypto charts.
Whether you’re a beginner or a seasoned trader, if you want to trade cryptocurrencies, you need to know how to read crypto charts. Charts can look intimidating at first glance, but they’re actually pretty simple once you know what you’re looking for. In this article, we’ll show you how to analyze crypto charts so you can make better-informed trading decisions.
How to analyse crypto charts for beginners
Cryptocurrencies are digital or virtual tokens that use cryptography to secure their transactions and to control the creation of new units. Cryptocurrencies are decentralized, meaning they are not subject to government or financial institution control. Bitcoin, the first and most well-known cryptocurrency, was created in 2009.
The most important things to look for when analysing crypto charts
When analysing crypto charts, the most important things to look for are:
1. Price trends
2. Volume trends
3. Technical indicators
4. Social media reaction
1. Price trends
If you are looking to make investment decisions, it is important to analyse the price trends of cryptocurrencies. This will give you an idea of whether the price of a particular coin is going up or down, and whether there is potential for long-term investment.
2. Volume trends
Another important factor to consider when analysing crypto charts is the volume of transactions that are being made. This will indicate how active the market is and whether there is potential for future price growth.
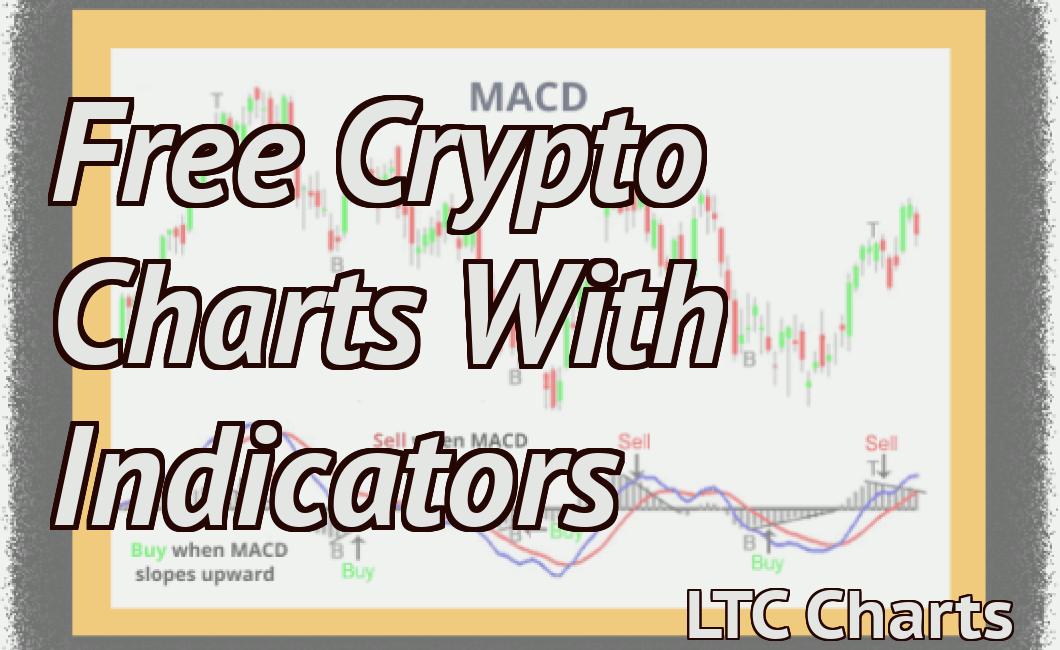
3. Technical indicators
Some of the most popular technical indicators that are used to analyse cryptocurrency charts include the RSI (Relative Strength Index), the MACD (Moving Averages Convergence Divergence), and the SMA (Simple Moving Average). These indicators can help you to determine whether the price of a particular coin is trending upwards or downwards, and whether there is potential for short-term or long-term investment.
4. Social media reaction
Finally, it is important to consider social media reaction when analysing crypto charts. This will give you an idea of whether there is strong investor interest in a particular coin, and whether there is potential for future price growth.
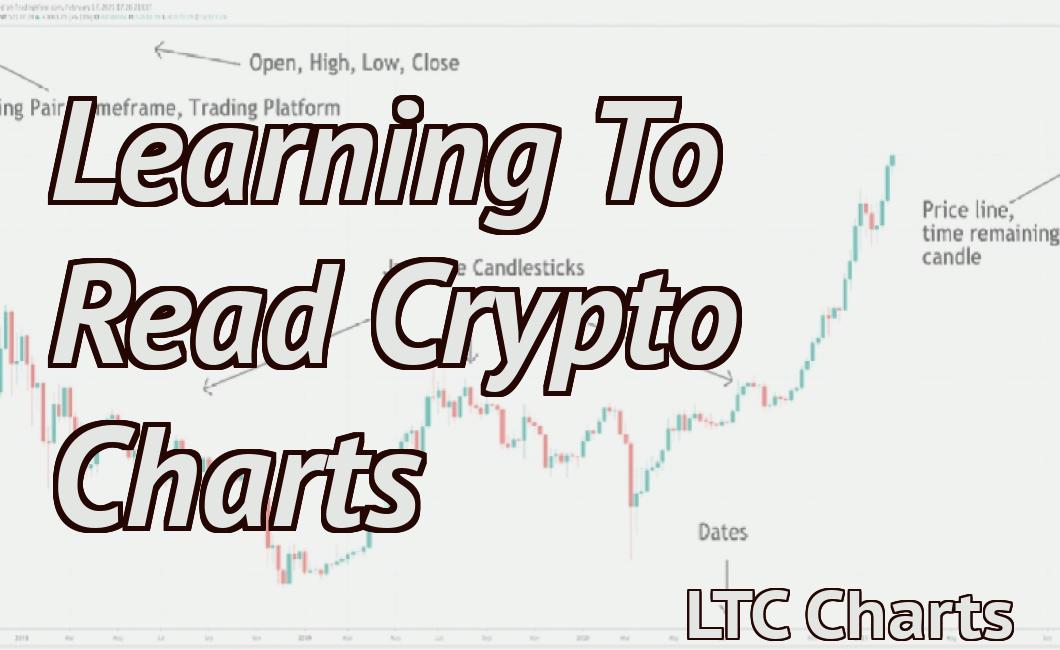
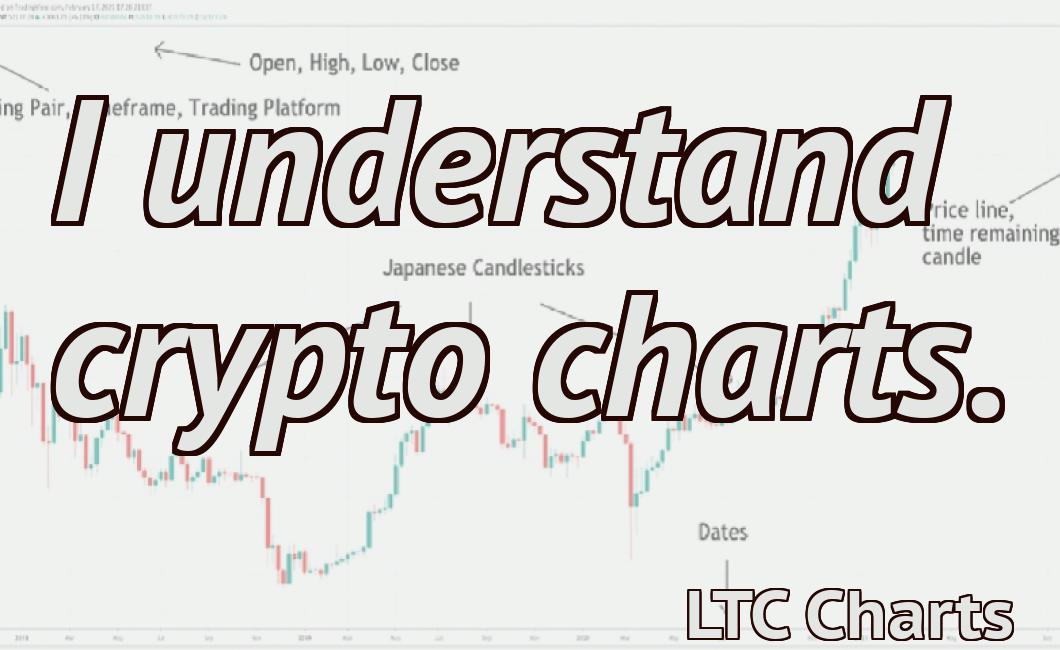
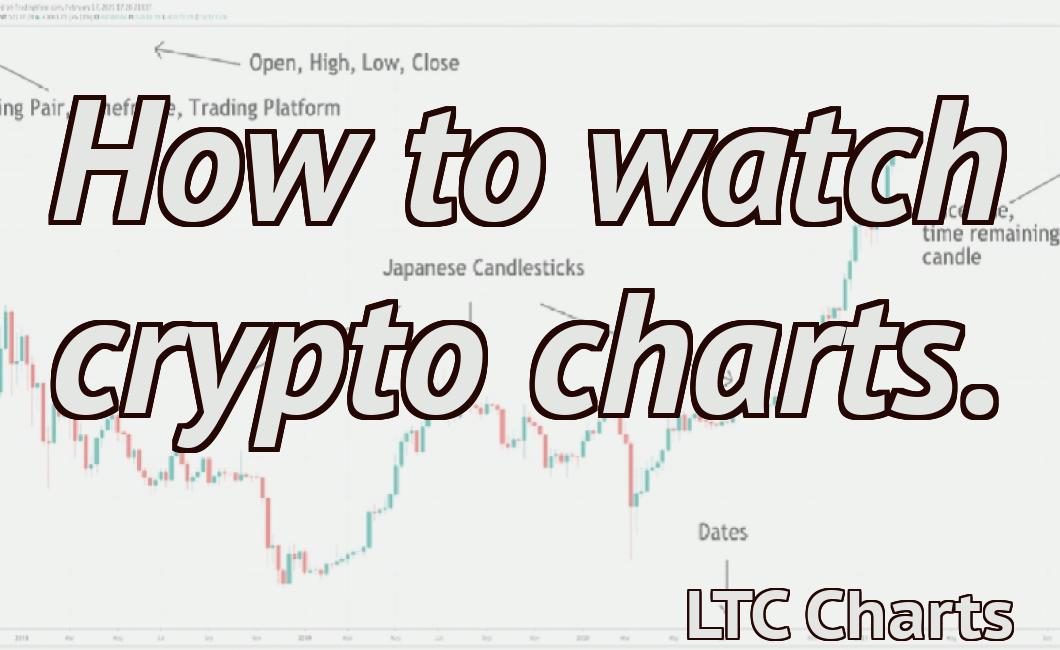
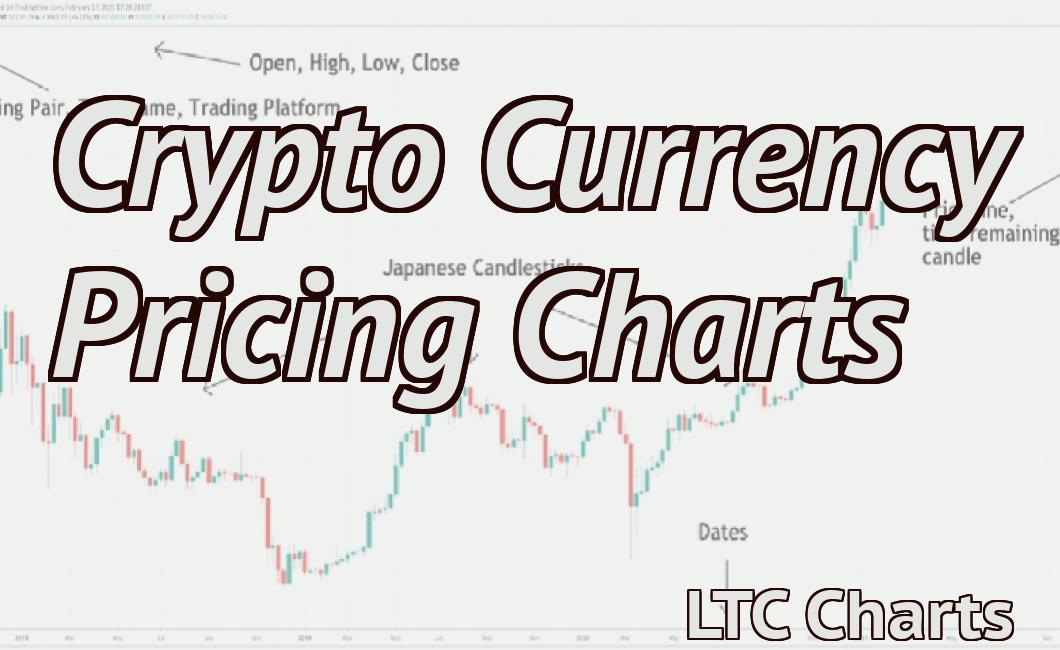
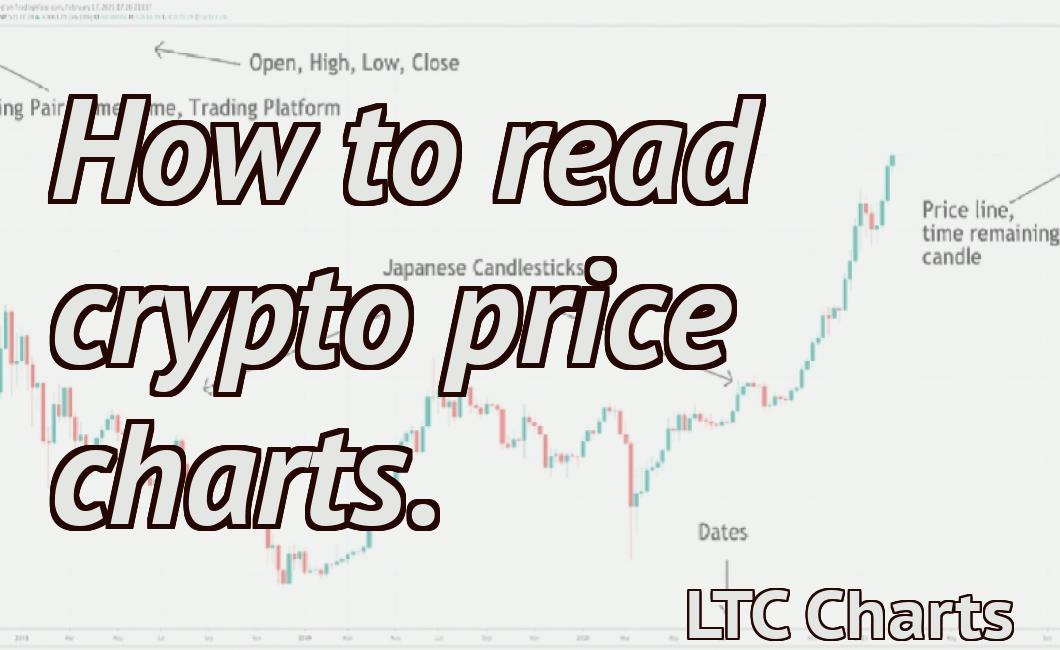
What do the different parts of a crypto chart mean?
A crypto chart is a graphical representation of the prices of digital assets over time. The different parts of a crypto chart represent different time periods. The vertical axis displays the prices of a digital asset, while the horizontal axis displays the time period.
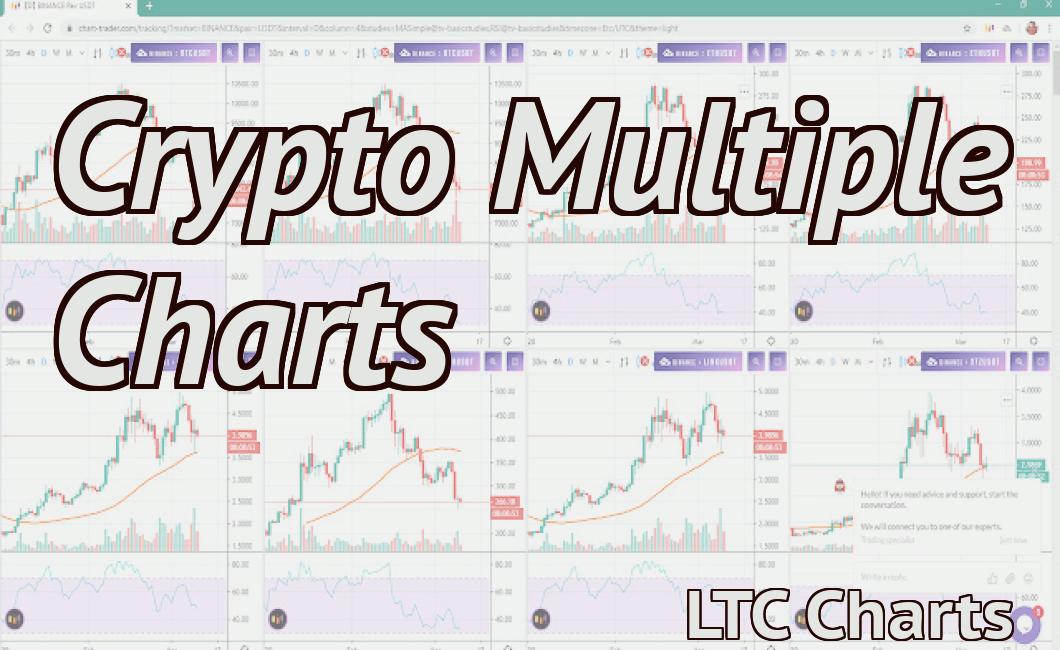
How to read crypto charts like a pro
Crypto charts are a great way to track the performance of individual cryptocurrencies and see how they are performing relative to each other.
There are a few things you need to know before you start charting:
1. Choose a cryptocurrency to track.
2. Choose a time frame.
3. Look for patterns.
4. Interpret the results.
1. Choose a cryptocurrency to track.
The first step is to choose a cryptocurrency you want to track. You can track any cryptocurrency that is available on a major exchange.
2. Choose a time frame.
Next, you need to choose a time frame to chart. You can chart any number of hours, days, or weeks. It's important to pick a time frame that will give you a good overview of the cryptocurrency's performance.
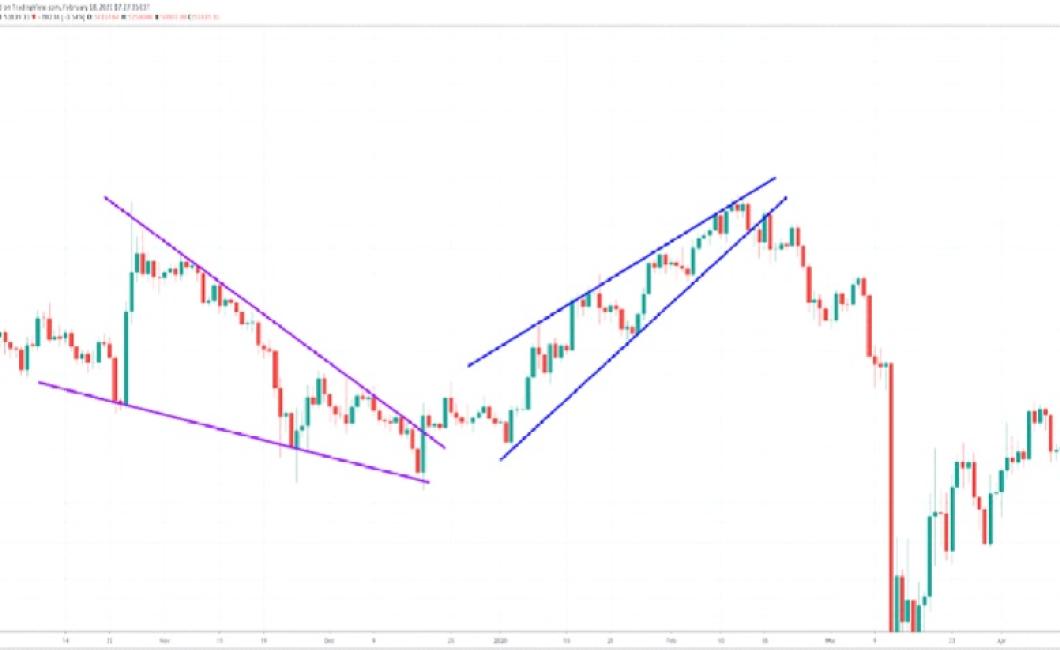
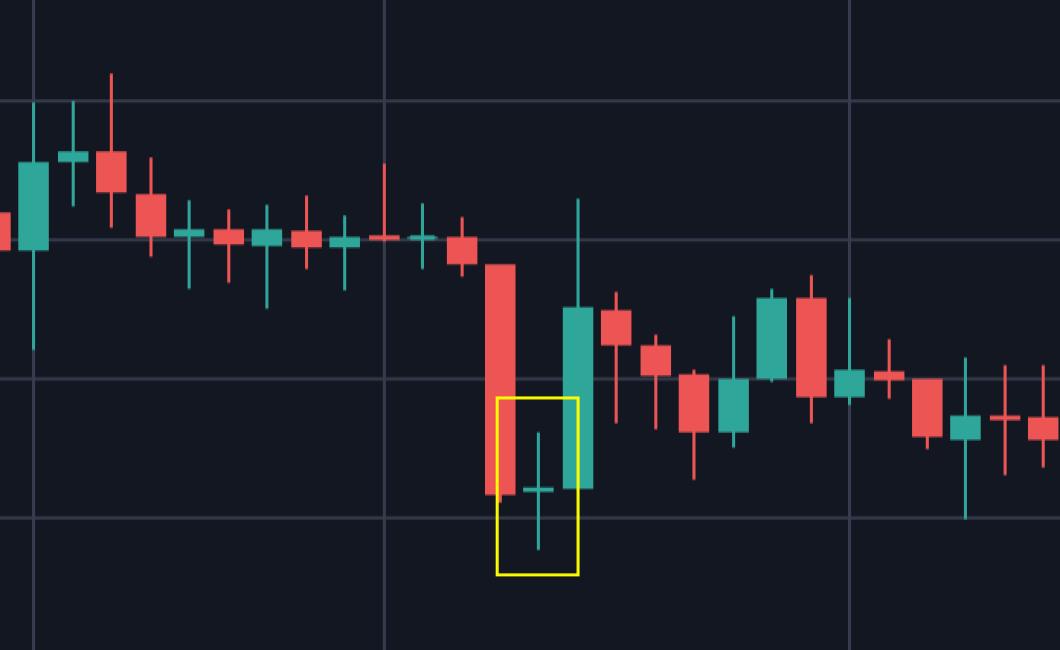
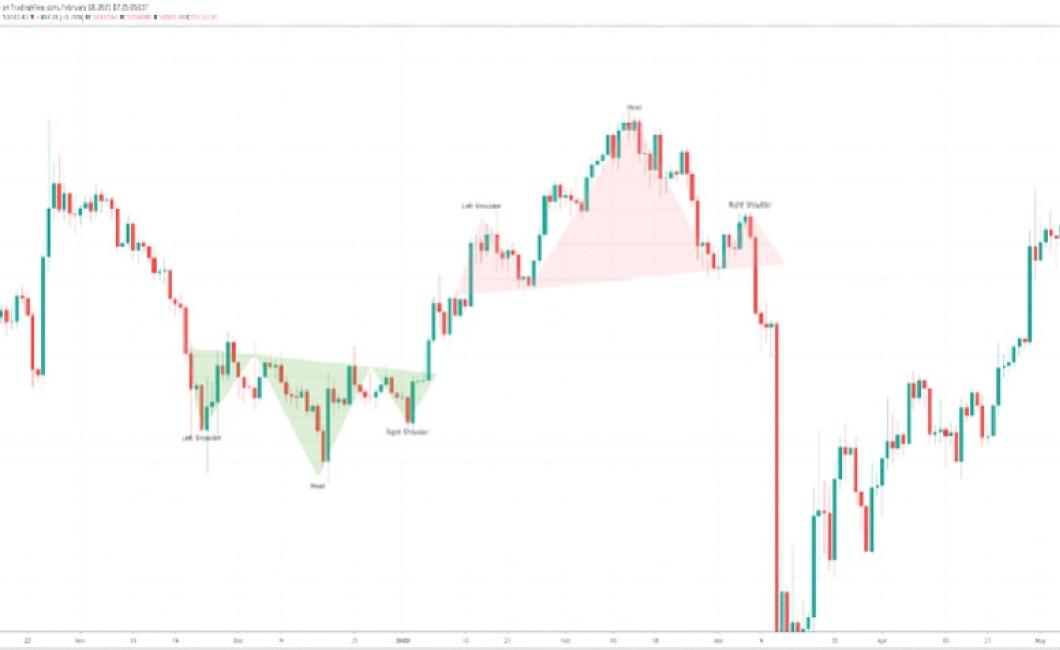
3. Look for patterns.
Once you have chosen your time frame and cryptocurrency, it's important to look for patterns in the data. Patterns can tell you a lot about the cryptocurrency's performance.
4. Interpret the results.
Once you have found patterns in the data, you can start to interpret them. This will help you understand how the cryptocurrency is performing and what trends you should watch out for.
How to find trends in crypto charts
In order to find trends in crypto charts, you will need to gather a few pieces of information.
The first thing you need to do is find the date of the chart. This can be found by clicking on the “Date” button on the chart.
Next, you will need to find the price of the cryptocurrency at that particular date. This can be found by clicking on the “Price” button on the chart.
Finally, you will need to find the volume of the cryptocurrency at that particular date. This can be found by clicking on the “Volume” button on the chart.
Once you have gathered all the information, you can begin to look for trends.
Some common trends to watch for include:
1. Is the price of the cryptocurrency increasing or decreasing over time?
2. Are the volumes of the cryptocurrency increasing or decreasing over time?
3. Are any specific cryptocurrencies experiencing particularly high or low prices or volumes?
4. Are any cryptocurrencies experiencing particularly high or low volumes compared to other cryptocurrencies?
How to use crypto charts to make better trading decisions
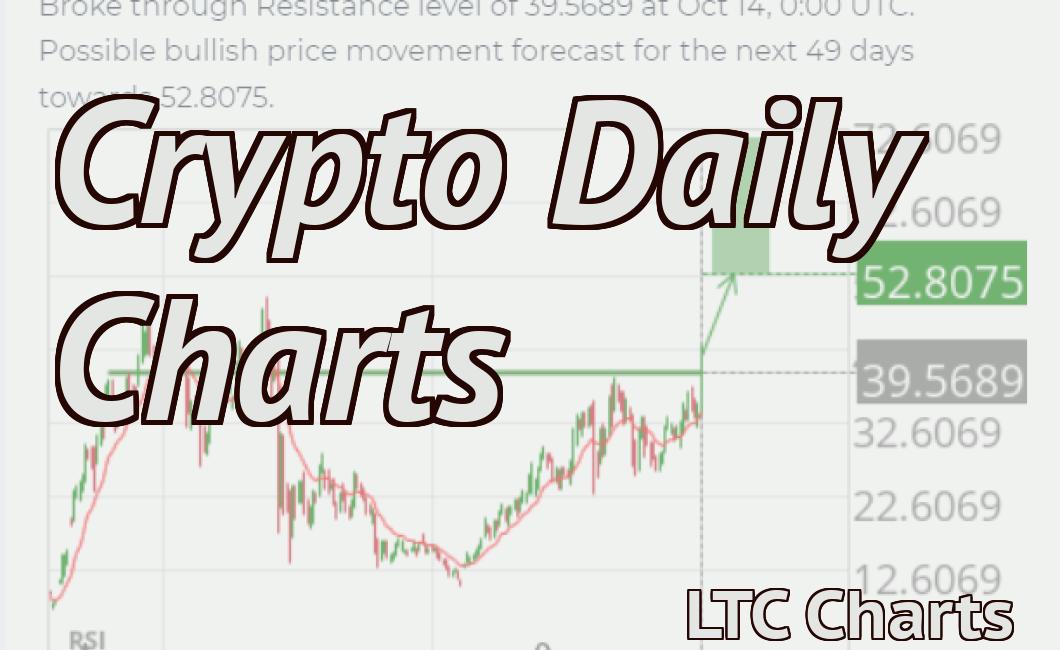
Crypto charts can be used to help make better trading decisions. By understanding where the price of a cryptocurrency is relative to its historical price, you can make informed decisions about whether to buy or sell.
For example, if you see that the price of a cryptocurrency has fallen below its previous price, this may be a sign that the cryptocurrency is in a downward trend. If you believe that the price of the cryptocurrency will continue to fall, it may be best to sell before the price falls further.
Similarly, if you see that the price of a cryptocurrency is climbing above its previous price, this may be a sign that the cryptocurrency is in an upward trend. If you believe that the price of the cryptocurrency will continue to rise, it may be best to buy before the price rises further.
What are the most important indicators to look for in crypto charts?
The most important indicators to look for in crypto charts are the price, volume, and change in price.
How to set up your own crypto chart analysis system
There is no one-size-fits-all answer to this question, as the setup and configuration of your own crypto chart analysis system will vary depending on your specific needs and preferences. However, some tips on how to set up your own crypto chart analysis system include:
1. Choose a suitable platform:
One key factor to consider when setting up your own crypto chart analysis system is the platform on which it will be run. While there are a variety of different platforms available, some of the most popular options include BitcoinCharts, CoinMarketCap, and TradingView.
2. Choose a cryptocurrency pair:
Once you have chosen a platform, the next step is to select a cryptocurrency pair to analyze. While there are a variety of different cryptocurrency pairs available, some of the most popular choices include Bitcoin/USD, Ethereum/USD, and Litecoin/USD.
3. Set up your charts:
Once you have selected a cryptocurrency pair and installed the appropriate platform, the next step is to set up your charts. Charts can be created using a variety of different tools, including BitcoinCharts, CoinMarketCap, and TradingView.
4. Analyze the data:
Once your charts are set up and data has been collected, it is important to analyze the data and formulate conclusions. This can be done using a variety of different tools, including BitcoinCharts, CoinMarketCap, and TradingView.
The ultimate guide to analysing crypto charts
Cryptocurrencies are digital or virtual tokens that use cryptography to secure their transactions and to control the creation of new units. Cryptocurrencies are decentralized, meaning they are not subject to government or financial institutions.
The first step in analysing crypto charts is to understand the basics of cryptocurrency. Cryptocurrencies are created as a reward for a process known as mining. Miners are rewarded with cryptocurrencies for verifying and confirming transactions on the blockchain.
Cryptocurrencies are often traded on digital exchanges and can also be used to purchase goods and services.
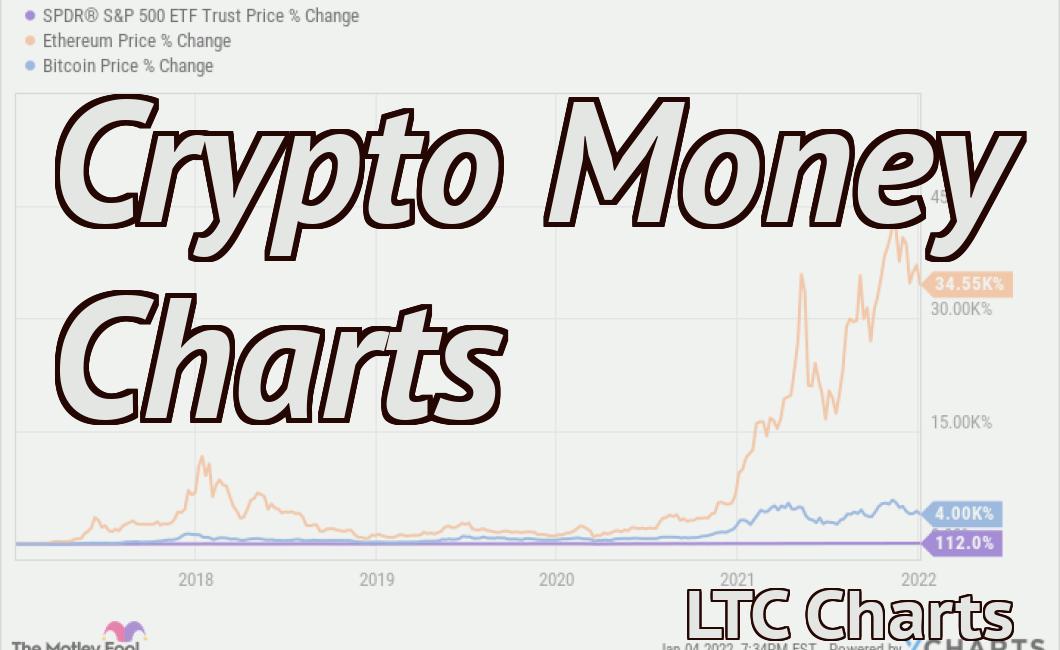
The next step is to analyse the price and volume of a cryptocurrency. Price is determined by supply and demand, and volume is determined by the number of transactions that have taken place.
Cryptocurrencies are volatile, meaning their prices can rise and fall a great deal. This makes it important to take into account the long-term prospects for a cryptocurrency when assessing its worth.