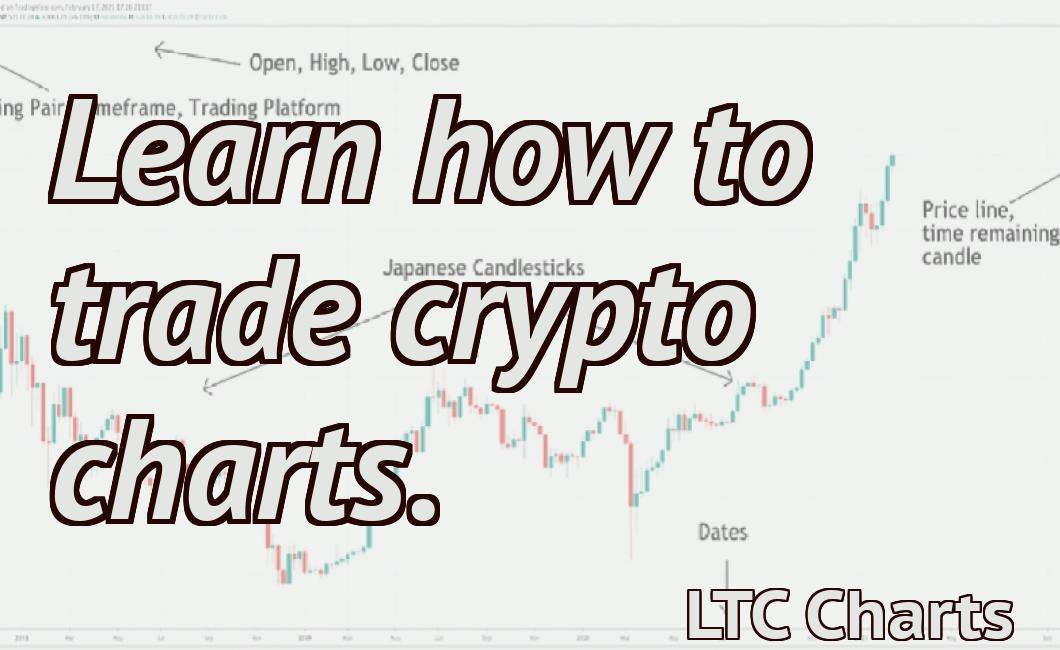
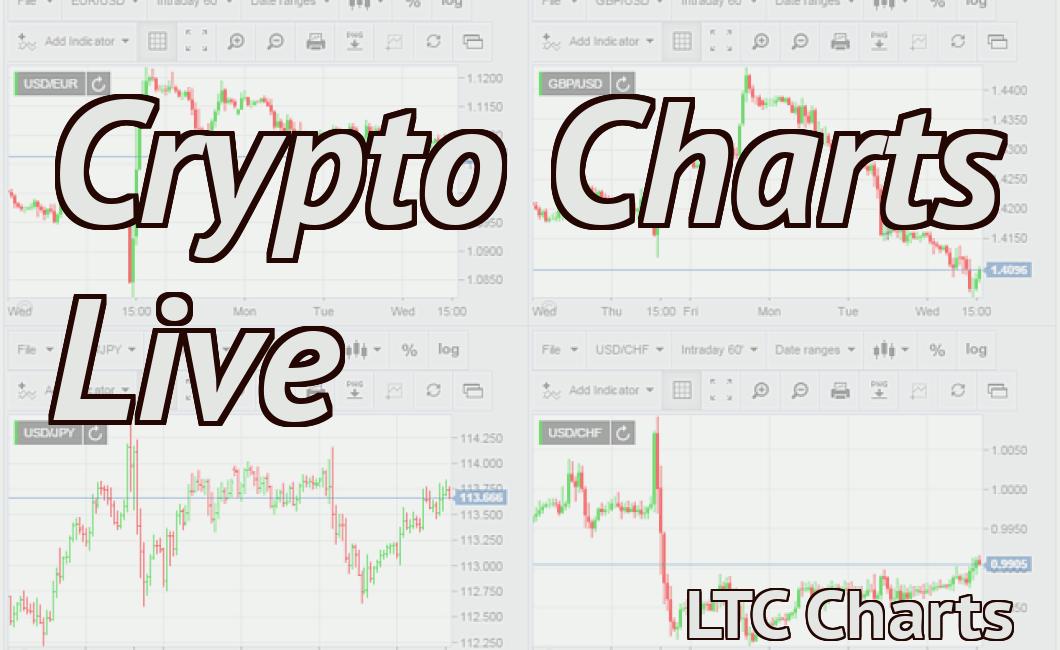
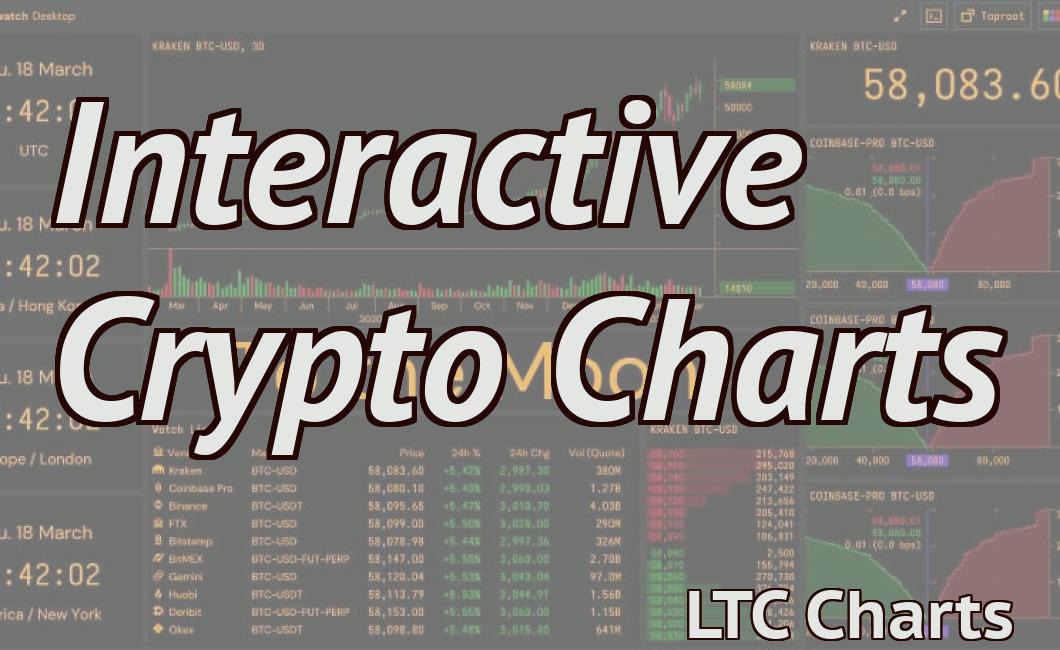
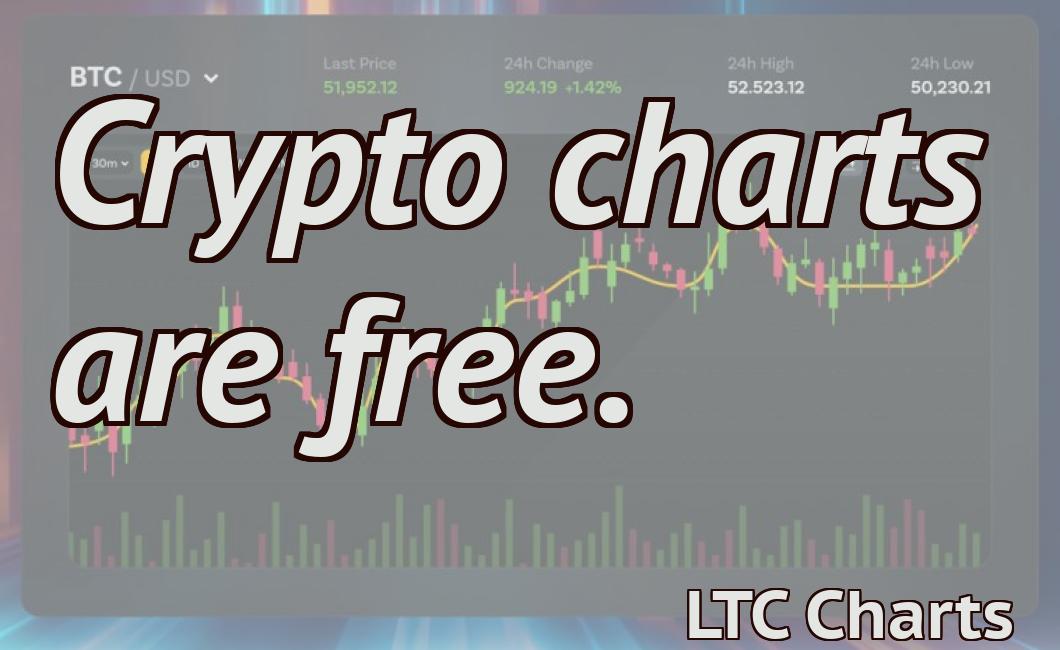
Understanding Crypto Charts
This article provides a basic understanding of crypto charts and how to read them. It covers the different types of charts and their features, as well as common charting techniques.
The Different Types of Crypto Charts and How to Use Them
Cryptocurrency charts are a great way to track the performance of a particular cryptocurrency. There are a few different types of crypto charts, and each one has its own advantages and disadvantages.
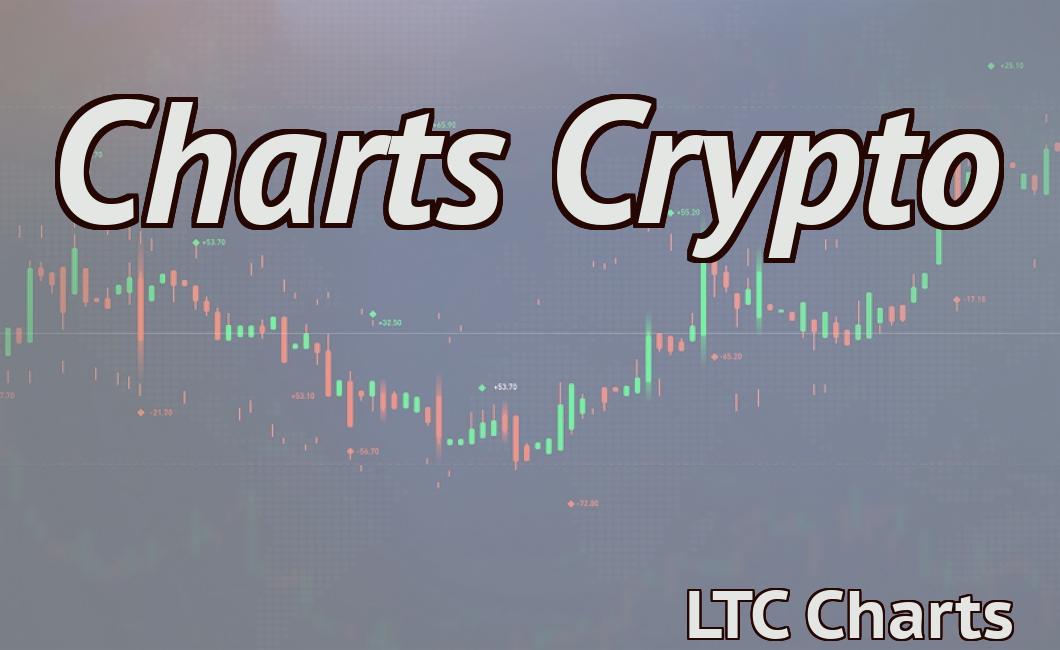
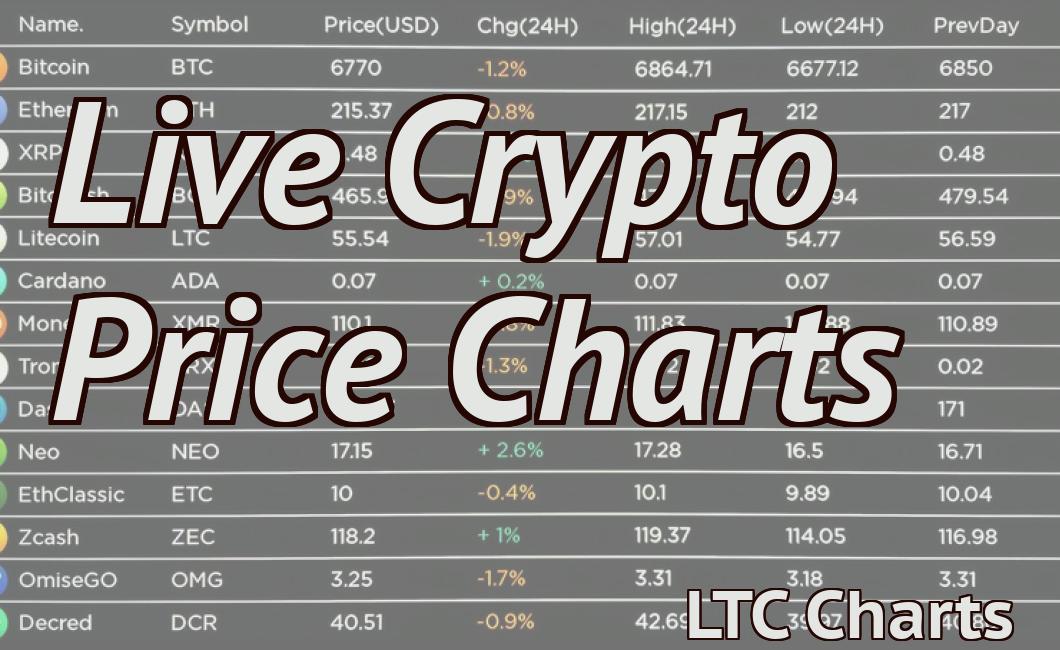
The most common type of crypto chart is the price chart. This chart displays the price of a cryptocurrency over time. The advantage of a price chart is that it's easy to see the changes in price over time.
Another type of crypto chart is the volume chart. This chart shows how much money is being traded in a given cryptocurrency over time. The advantage of a volume chart is that it can help you identify which cryptocurrencies are popular.
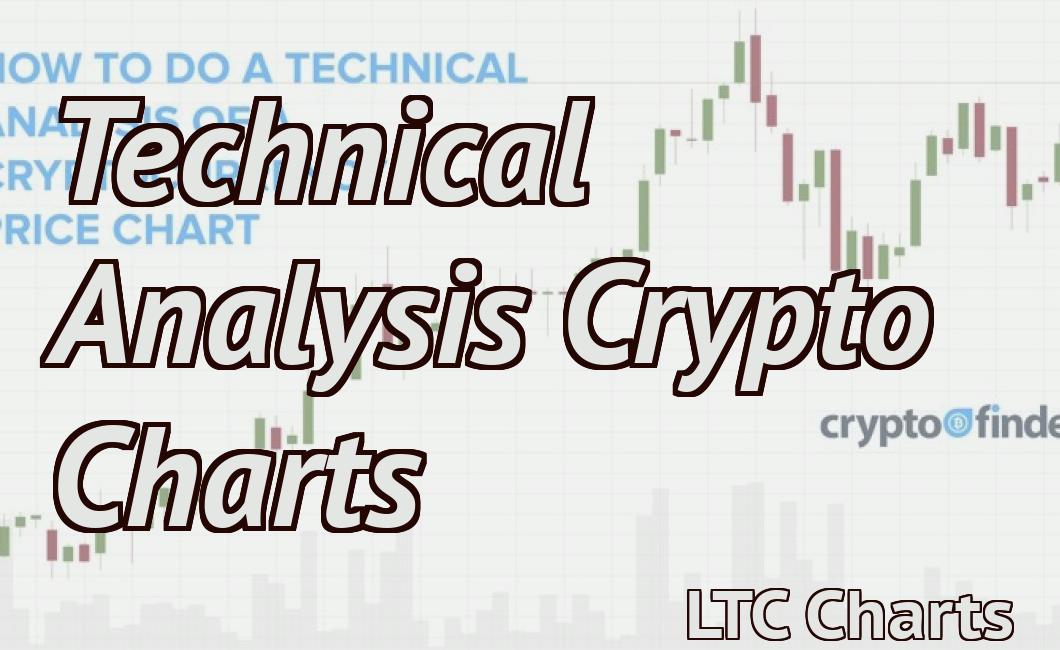
Another type of crypto chart is the technical analysis chart. This chart uses indicators to show whether a cryptocurrency is over or undervalued. The advantage of a technical analysis chart is that it can help you identify trends in the market.
A Beginner's Guide to Reading Crypto Charts
Cryptocurrency charts are a great way to stay up-to-date on the latest trends and movements in the crypto world. By following these charts, you can gain an understanding of where each coin is trading and what factors are influencing its price.
1. Browse the different exchanges where cryptocurrencies are traded.
Each exchange has its own cryptocurrency chart, so it's important to look at a few different ones in order to get a broad overview of the market. Some of the most popular exchanges include Binance, Bitfinex, and Coinbase.
2. Look at the overall trend of the coin.
Following the overall trend of a coin can help you predict where it is likely to go next. If a coin is trending up, it is likely that its price will continue to rise. Conversely, if a coin is trending down, its price is likely to fall.
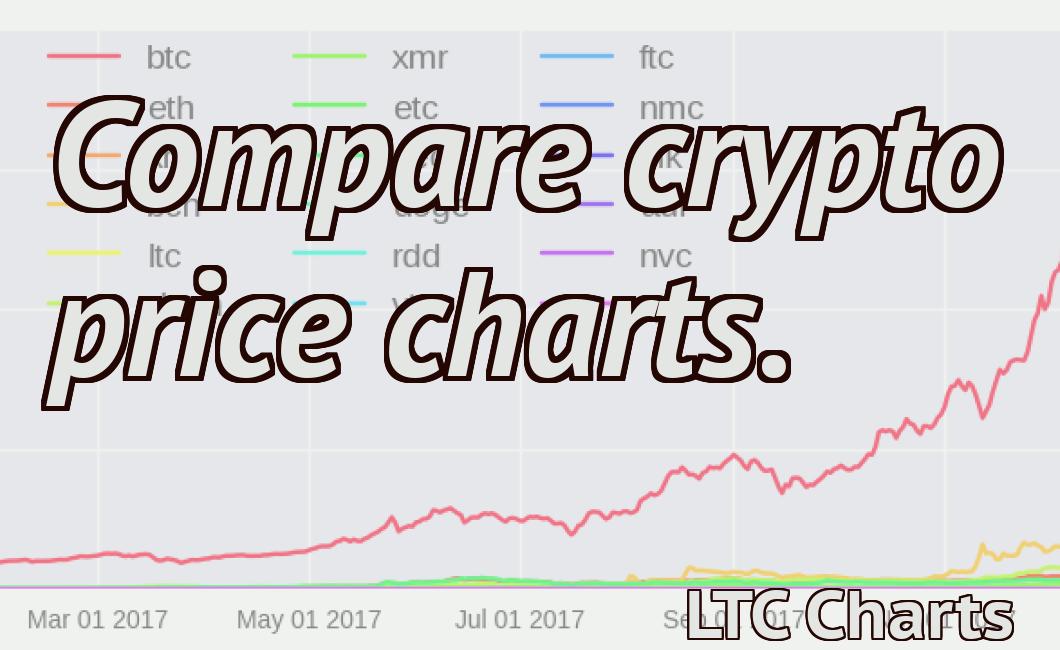
3. Compare prices across different exchanges.
Sometimes one exchange will have a higher price for a particular cryptocurrency than another. Be sure to compare prices before making a purchase.
4. Watch for news announcements that could affect the price of a cryptocurrency.
For example, if a company announces that it plans to start accepting cryptocurrencies as payment, its value could surge on the exchange. Similarly, if a new cryptocurrency is released and begins to gain popularity, its price could rise.
5. Look for signals that suggest a potential buying opportunity.
When you see signs that suggest a potential buying opportunity, it can help you gain an advantage over other traders and increase your chances of making a successful purchase. For example, if a coin is trading at a low price on one exchange, but is starting to trend upwards on other exchanges, this may be an indication that there is a potential buying opportunity.
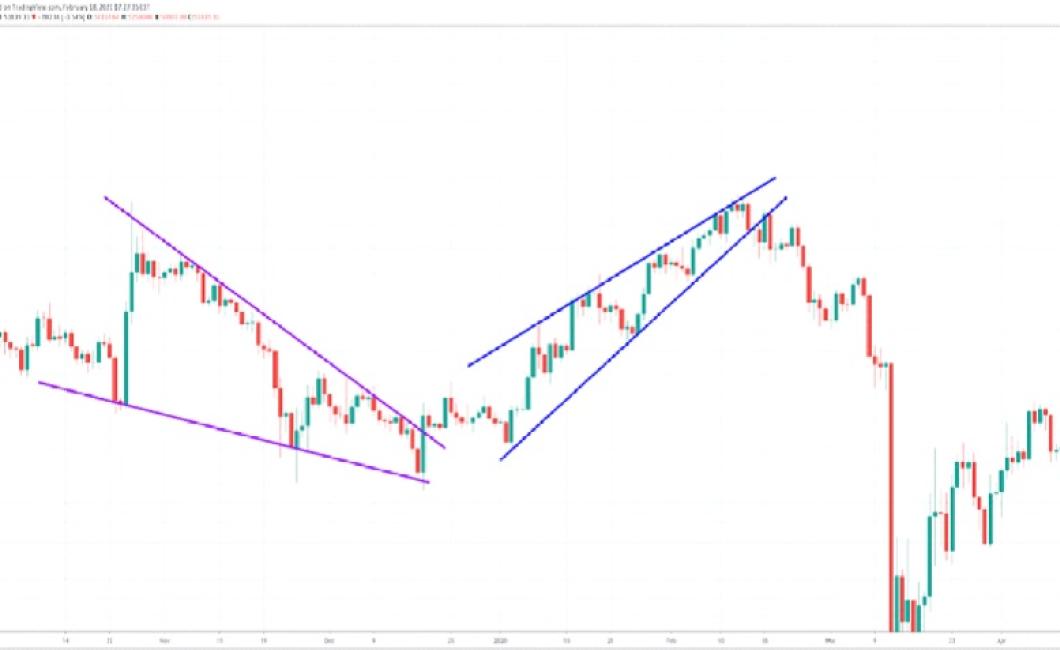
The Most Important Crypto Chart Patterns You Need to Know
There are a lot of different crypto chart patterns that traders and investors need to be aware of. Some of the most common patterns include head-and-shoulders, ascending triangles, descending triangles, and Fibonacci retracements.
1. Head-And-Shoulder Pattern
The head-and-shoulders pattern is one of the most common crypto chart patterns. This pattern is formed when the price of a cryptocurrency rises steadily in a narrow range before hitting a peak. After the peak is hit, the price begins to decline, and the pattern is completed when the price falls below the previous peak.
2. Ascending Triangle
An ascending triangle is another common crypto chart pattern. This pattern is formed when the price of a cryptocurrency rises steadily in a narrow range before hitting a peak. After the peak is hit, the price begins to decline, but the decline is not as steep as the rise. The pattern is completed when the price falls below the previous peak.
3. Descending Triangle
A descending triangle is another common crypto chart pattern. This pattern is formed when the price of a cryptocurrency falls steadily in a narrow range before hitting a bottom. After the bottom is hit, the price begins to rise, and the pattern is completed when the price falls below the previous bottom.
4. Fibonacci Retracements
Fibonacci retracements are another common crypto chart pattern. This pattern is formed when the price of a cryptocurrency moves in a predictable sequence based on Fibonacci numbers. The sequence starts with 0.618, then 0.382, then 0.236, and so on. When the sequence is complete, the price will have reached the Fibonacci number associated with the previous level.
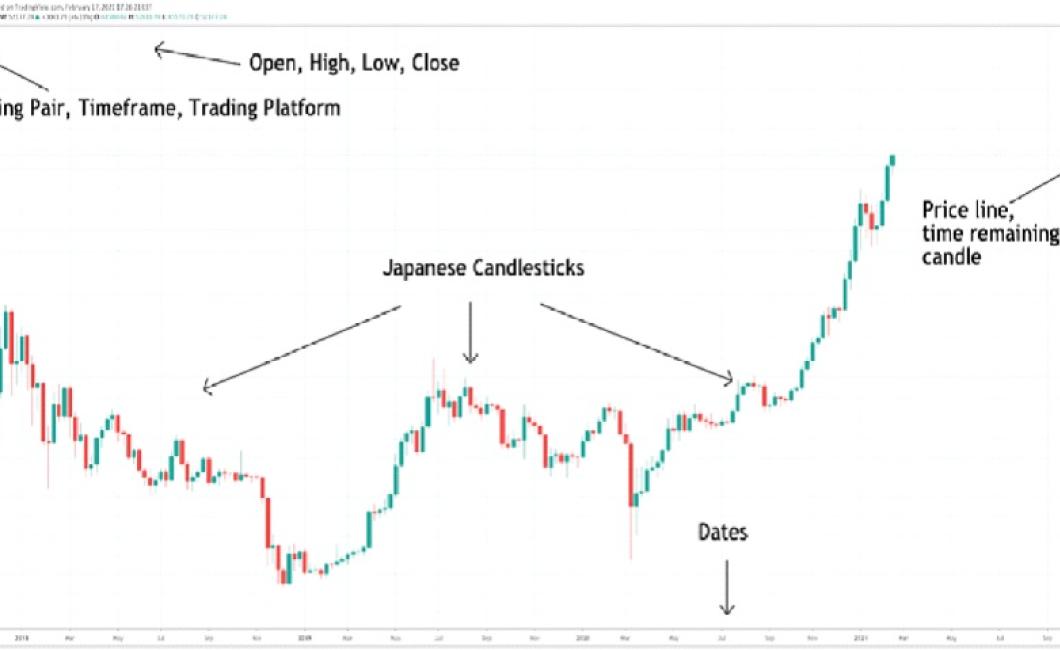
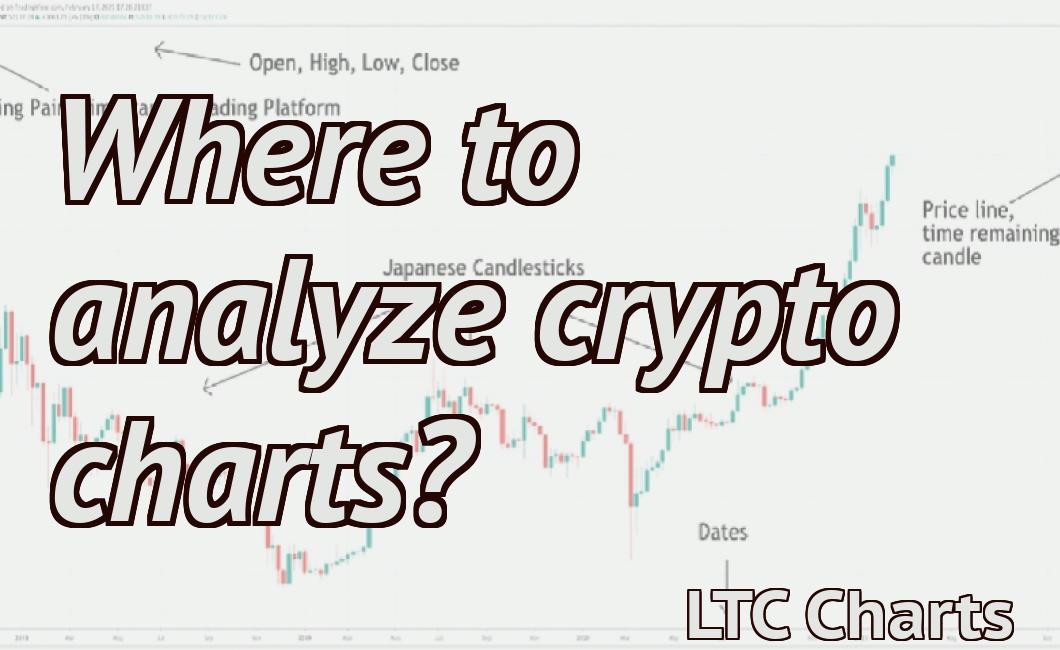
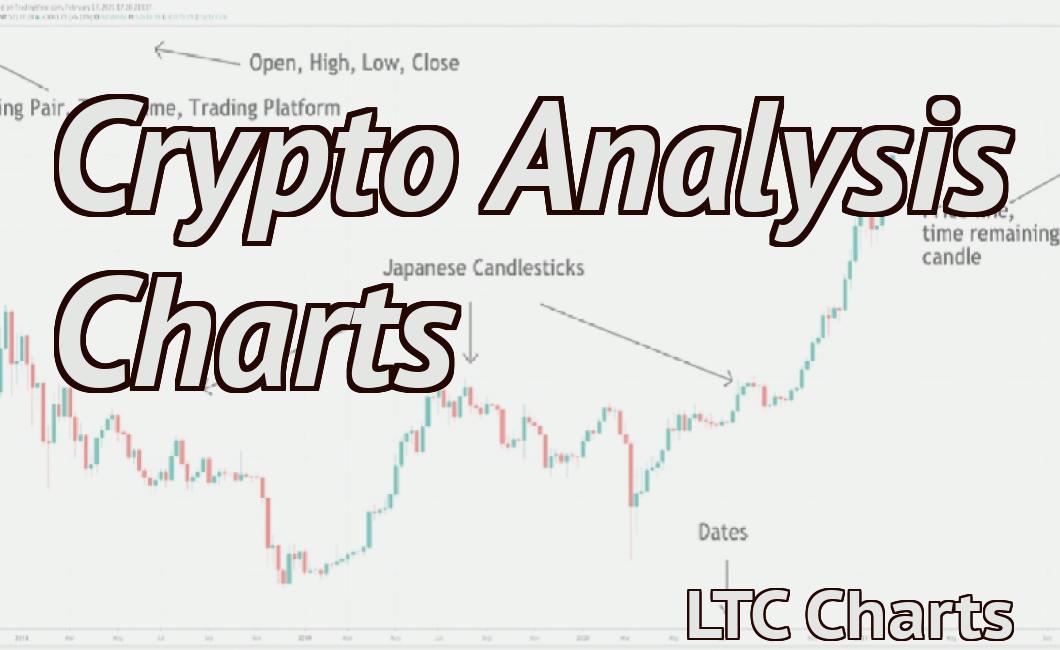
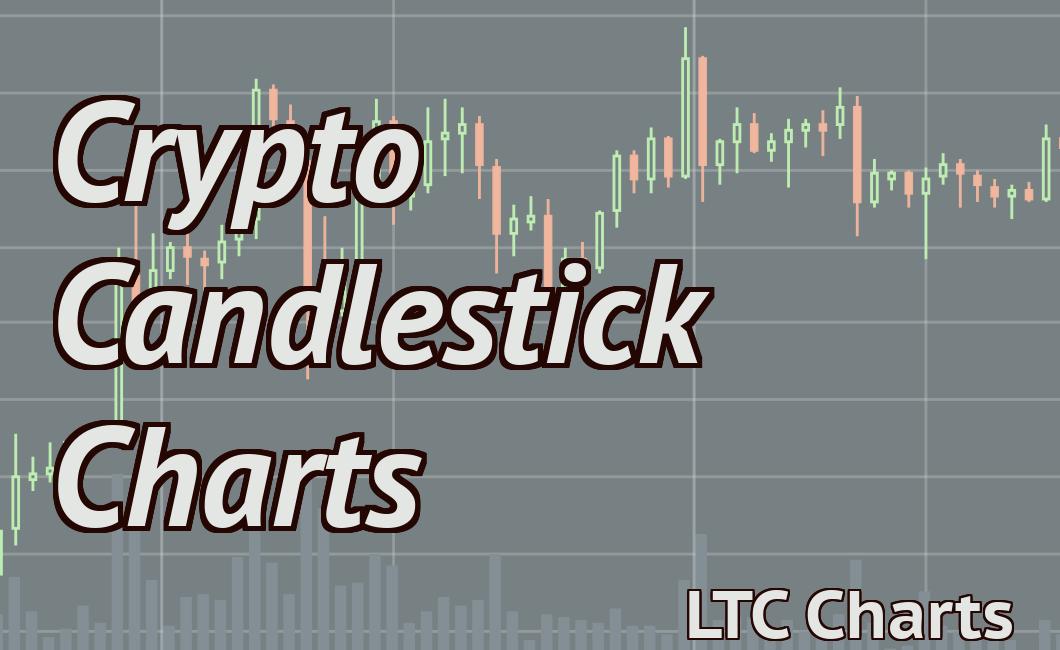
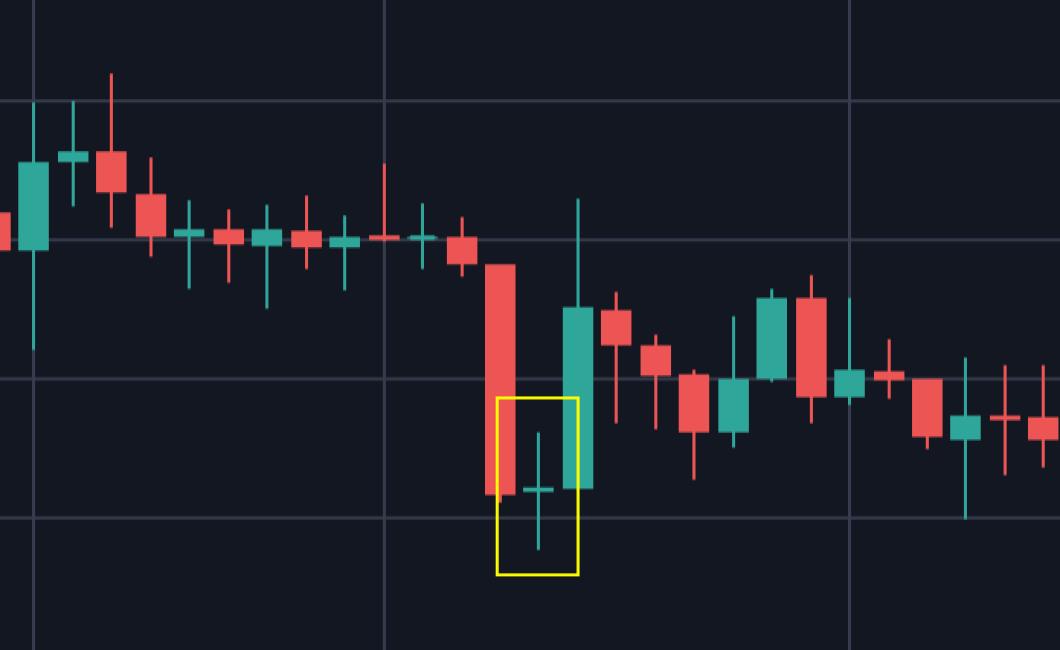
How to Use Candlestick Charts to Trade Cryptocurrencies
Candlestick charts are a popular way to trade cryptocurrencies. They show the price of a cryptocurrency at different points in time, which can help you track the price movement of a particular coin.
To use candlestick charts to trade cryptocurrencies:
1. Open a digital wallet that supports cryptocurrencies.
2. Scan the blockchain for the latest price of a cryptocurrency you want to trade.
3. Find the candlestick chart for that cryptocurrency and open it.
4. Look for the green and red lines on the chart. The green line is the price at which the cryptocurrency was sold, and the red line is the price at which it was bought.
5. Make sure that you are buying and selling at the same price point on the chart. If not, you may lose money.
6. Hold onto your cryptocurrency until the candlestick chart shows a new price point, and then sell it at that point.
The Most Commonly Used Crypto Technical Indicators
Cryptocurrencies are a new technology and as such, their technical indicators are in their early stages of development. As such, there is no single set of technical indicators that is universally accepted as being the most accurate.
Instead, different cryptocurrency communities tend to use different indicators, with some being more popular than others. However, there are a few indicators that are generally accepted as being the most commonly used.
The following are the three most commonly used crypto technical indicators:
1. Price Volatility
This is arguably the most important indicator of all, as it reflects the overall health of the cryptocurrency market. Price volatility is measured using the standard deviation of the price over a given period of time.
2. Network Activity
Network activity is another key indicator that is used to measure the health of the cryptocurrency market. Network activity is measured using the number of transactions per day on the network.
3. Coin Volume
Coin volume is another key indicator that is used to measure the health of the cryptocurrency market. Coin volume is measured by multiplying the price of a cryptocurrency by the total number of coins that are in circulation.
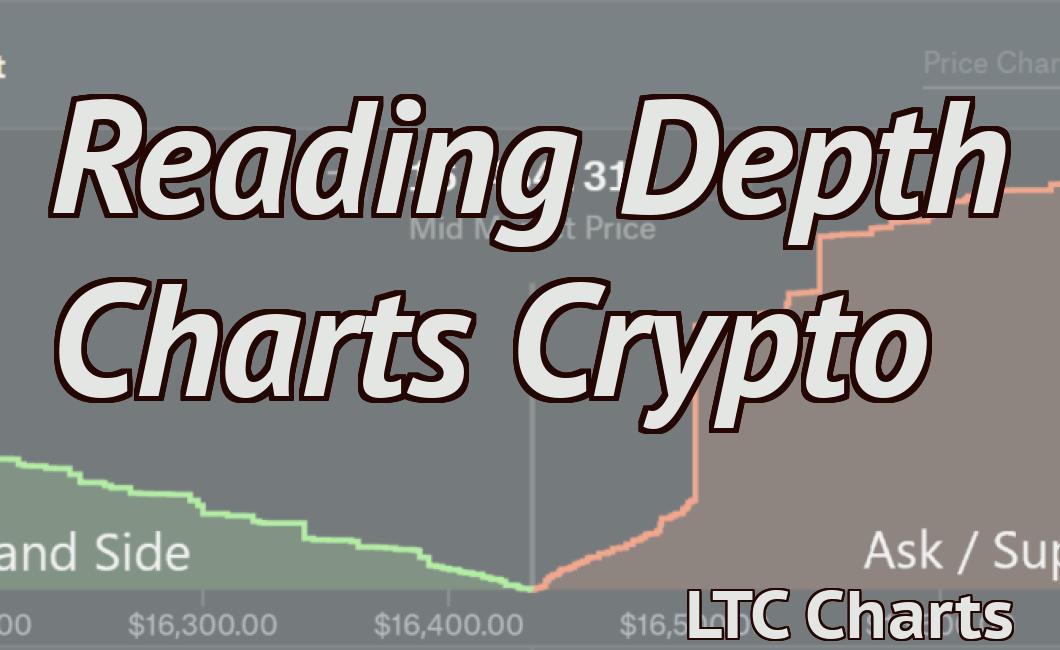
How to Read and Analyze Cryptocurrency Order Books
Cryptocurrency order books can be analyzed in a few different ways. One way to analyze an order book is to look at the size of the orders. Another way to analyze an order book is to look at the liquidity of the orders. Finally, another way to analyze an order book is to look at the price action of the orders.
One way to look at the size of the orders in a cryptocurrency order book is to see how large the orders are compared to the available supply of the cryptocurrency. This can be measured in terms of percentage of the total supply or in terms of number of coins. For example, if there are 100 million coins available and there are 1,000 orders for 50% of the total supply, then the order book would have 50 orders.
Another way to look at liquidity in a cryptocurrency order book is to see how quickly the orders are being filled. This can be measured in terms of minutes, hours, or days. For example, if there are 10,000 orders for a cryptocurrency and it takes 60 minutes for the orders to be filled, then the liquidity of the order book would be rated as “fairly liquid”.
Finally, another way to look at liquidity in a cryptocurrency order book is to see how quickly the prices of the cryptocurrency are moving. This can be measured in terms of percentage change, absolute change, or cumulative change. For example, if the price of a cryptocurrency is moving up by 10% every day and there are 10,000 orders for that cryptocurrency, then the liquidity of the order book would be rated as “very liquid”.
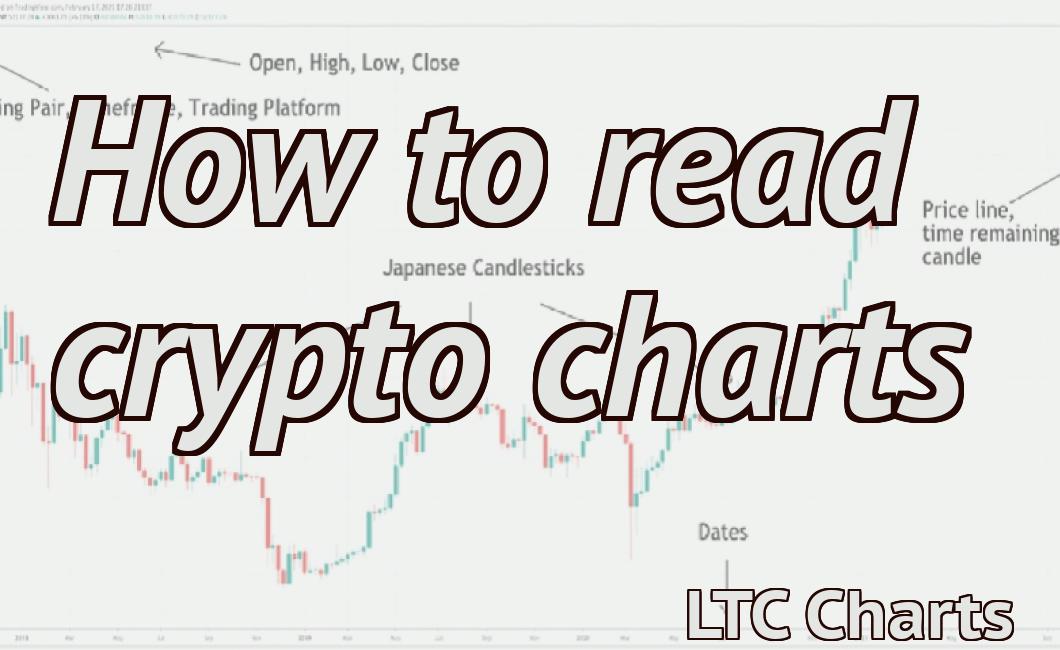
What Do All Those Squiggly Lines Mean? A Beginner's Guide to Crypto Charting
Cryptocurrencies are a new and volatile asset class. As such, it's important to stay up-to-date on the latest trends and technical analysis in order to make sound investment decisions. Here is a beginner's guide to crypto charting.
What is a Crypto Chart?
A crypto chart is a graphical representation of the price of a cryptocurrency over time. Chartists use charts to identify patterns in the price movement of a cryptocurrency and to predict future price movements.
How Do Crypto Charts Work?
Cryptocurrencies are traded on decentralized exchanges and can therefore move rapidly and unpredictably. Cryptocurrency prices are displayed on crypto charts in real time as well as in historical time. Crypto charts also typically display a price action graph and a supply and demand graph.
What are the Uses of Crypto Charts?
Crypto charting can be used for a variety of purposes, including market analysis, price prediction, and portfolio management.
Market Analysis
Crypto charting can help you identify patterns in the price movement of a cryptocurrency and to predict future price movements.
Price Prediction
Crypto charting can help you identify trends in the price movement of a cryptocurrency and to predict when and how the price will change.
Portfolio Management
Crypto charting can help you identify opportunities and risks in the price movement of a cryptocurrency.
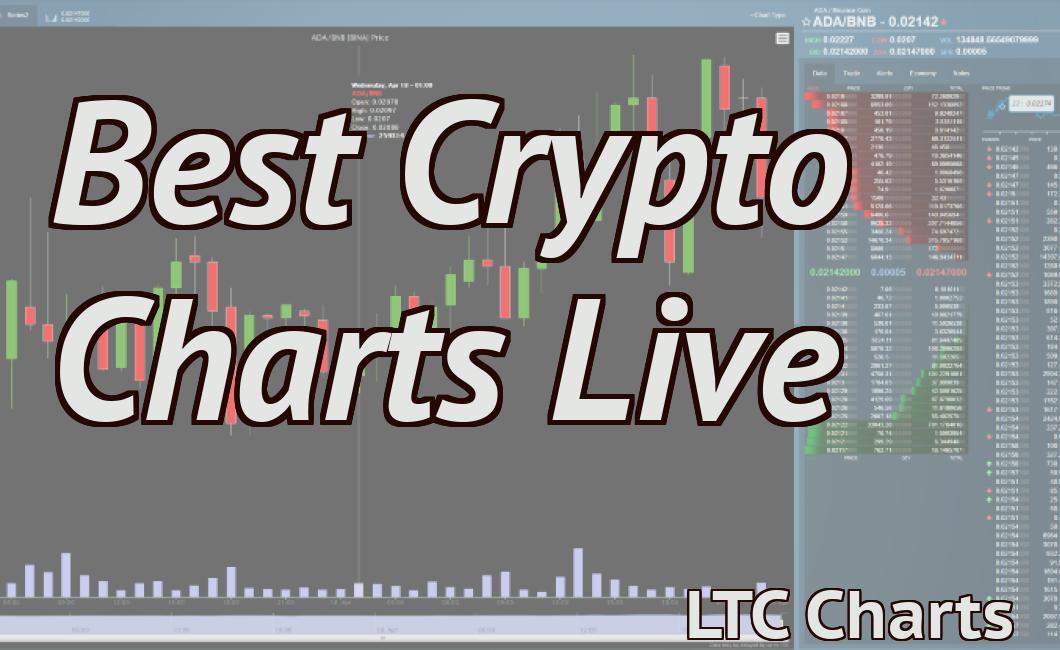
Tradingview 101: The Beginner's Guide to Using Crypto Charts
Crypto trading can be a very exciting and profitable way to make money, but it can also be a bit confusing if you don't know what to look for. In this guide, we'll teach you the basics of how to use crypto charts, so that you can start making profitable trades right away!
What are crypto charts?
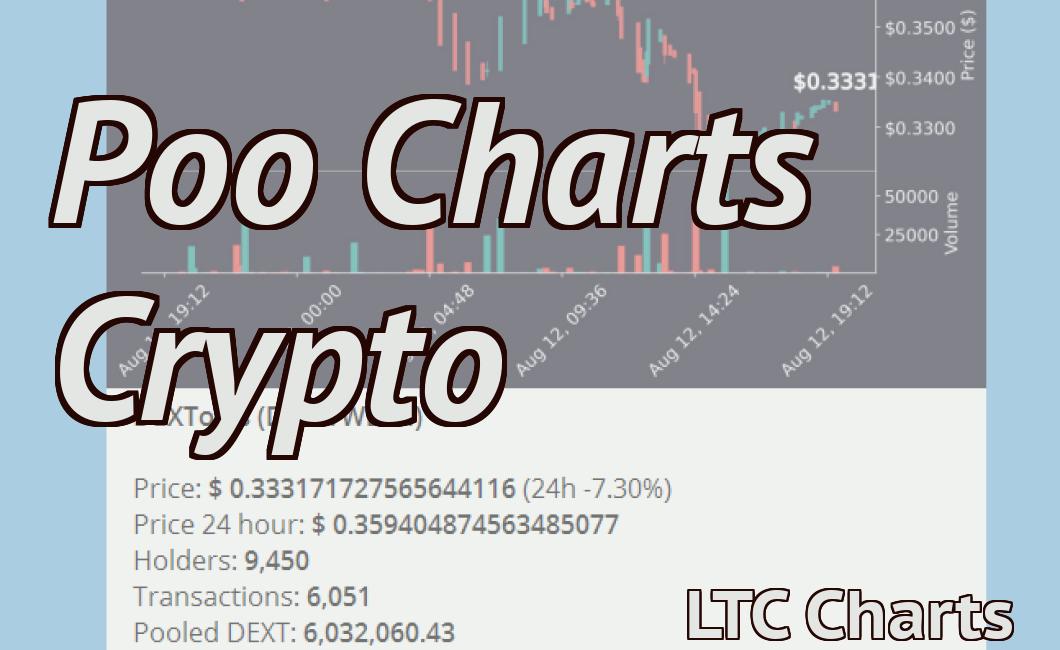
Crypto charts are a way to track the prices of cryptocurrencies like Bitcoin and Ethereum. They show the price of a cryptocurrency over time, as well as the volume of trades that have taken place.
How do I use crypto charts?
To use crypto charts, first you'll need to find a cryptocurrency exchange that offers them. Once you've found an exchange, open it up in your browser and click on the "Charts" tab. This will bring up a page that looks something like this:
On the left-hand side of the page, you'll see a list of all the cryptocurrencies that are being traded on the exchange. Below that, you'll see a graph that shows the price of each cryptocurrency over time.
To use crypto charts, first you'll need to find a cryptocurrency exchange that offers them.
To use crypto charts, first you'll need to find a cryptocurrency exchange that offers them. Once you've found an exchange, open it up in your browser and click on the "Charts" tab. This will bring up a page that looks something like this:
On the left-hand side of the page, you'll see a list of all the cryptocurrencies that are being traded on the exchange. Below that, you'll see a graph that shows the price of each cryptocurrency over time.
To use crypto charts, first you'll need to find a cryptocurrency exchange that offers them. Once you've found an exchange, open it up in your browser and click on the "Charts" tab. This will bring up a page that looks something like this:
In the bottom left-hand corner of the page, you'll see a list of all the coins that are being traded on the exchange. If you click on one of those coins, it will take you to a separate page where you can see the price and volume data for that coin.
How can I use crypto charts to make money?
One of the most popular ways to use crypto charts is to try and predict when a cryptocurrency is going to go up or down in price. For example, if you think that Bitcoin is going to go up in price, you could buy some Bitcoin before it goes up in price, and sell it later when it goes down in price. This is called "day trading".
Another way to use crypto charts is to try and find good investments. For example, if you think that Ethereum is going to go up in price, you could buy some Ethereum before it goes up in price, and sell it later when it goes down in price. This is called "long-term investing".
There are also other ways to make money using crypto charts, but these are the two most common. So if you're interested in making money using crypto charts, be sure to check out our guides on how to day trade and how to long-term invest!
How to Spot Trend Reversals Using Technical Analysis
Technical analysis is a way to identify and analyze trends in financial markets. A trend can be identified when the price of a security or commodity appears to be moving in a certain direction for an extended period of time. When a trend is confirmed, it can provide investors with an opportunity to make profitable investments.
To identify trend reversals, you need to look for changes in two key indicators: the price of a security or commodity and the volume of trading. When these indicators start to move in the opposite direction from each other, that is often a sign that the trend is reversing.
You can also use technical analysis to predict when a trend is likely to end. If the indicators are moving in the same direction but are gradually increasing in volume, that might be a sign that the trend is about to reach its peak and start to reverse.
3 Simple Strategies for Trading Cryptocurrencies with Candlestick Charts
1. Use a trailing stop.
If you’re trading cryptocurrency with candlestick charts, set a stop loss if the price falls below the previous candlestick’s low and then wait for the price to reach the stop loss before taking any new bids. If the price rises above the stop loss, then you can sell your cryptocurrency at this point.
2. Use a profit target.
If you’re trading cryptocurrency with candlestick charts, set a profit target if the price reaches a certain height above the previous candlestick’s high. Once the price reaches this target, you can then sell your cryptocurrency.
3. Use a trendline.
If you’re trading cryptocurrency with candlestick charts, use a trendline to help identify when the price is likely to rise or fall. Once you identify a trendline, use it to help predict how high or low the price is likely to go.
How to Use Volume Analysis to Trade Cryptocurrencies
Volume analysis is a tool that traders can use to help them make informed decisions about which cryptocurrencies to trade. Volume analysis looks at the number of trades that have occurred in a given cryptocurrency over a certain period of time.
Traders can use volume analysis to help them determine whether a cryptocurrency is over or undervalued. They can also use volume analysis to help them determine when they should buy or sell a cryptocurrency.
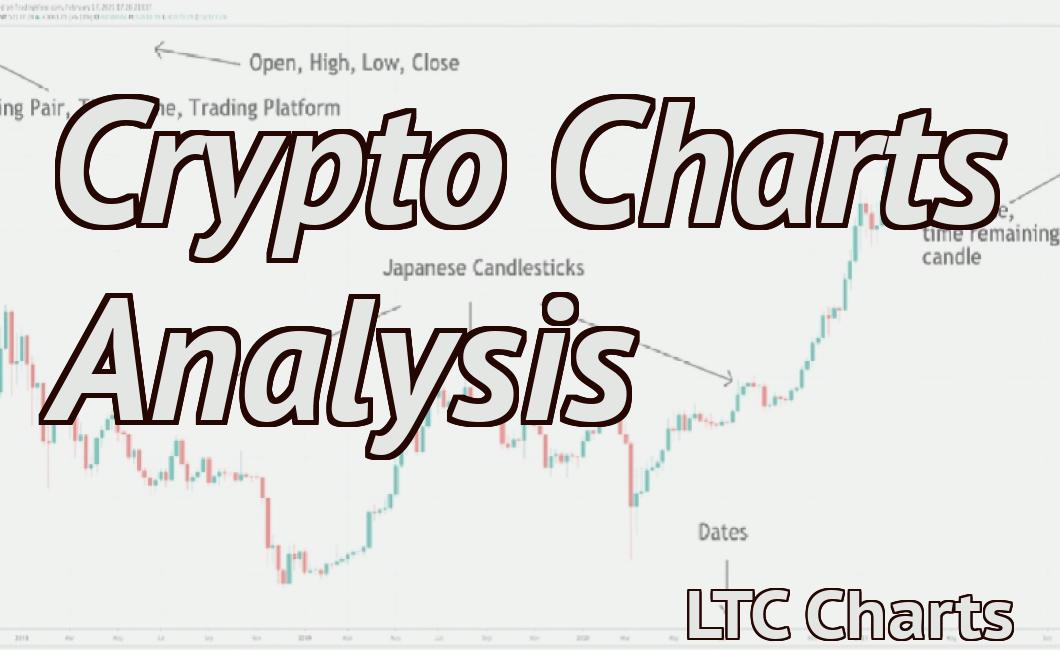
What Is Cryptocurrency Technical Analysis?
Cryptocurrency technical analysis is the study of how cryptocurrency prices are affected by various technical indicators. These indicators can help traders make informed decisions about when and how to buy or sell cryptocurrencies.
Some common technical indicators used in cryptocurrency technical analysis include:
The price of a cryptocurrency relative to its historical price
The volume of a cryptocurrency
The percentage of a cryptocurrency's total supply that is currently being traded
The price of a cryptocurrency over a specific period of time, such as the past 24 hours or past 7 days
Cryptocurrency technical analysis can help traders make informed decisions about when and how to buy or sell cryptocurrencies. By understanding how these indicators are linked, traders can develop general strategies for trading cryptocurrencies.