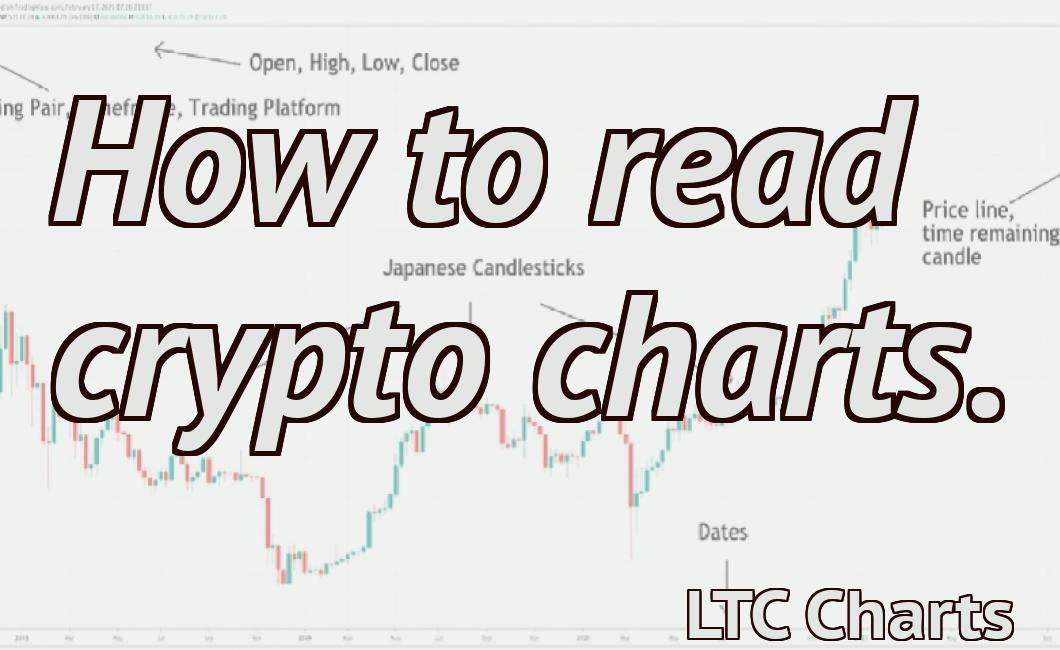
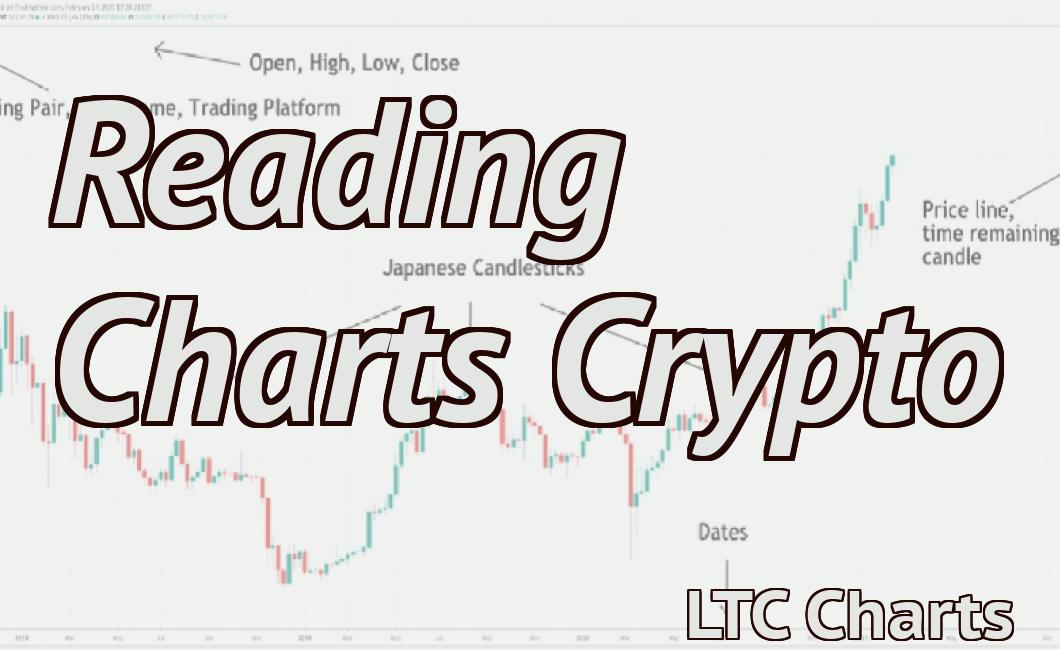
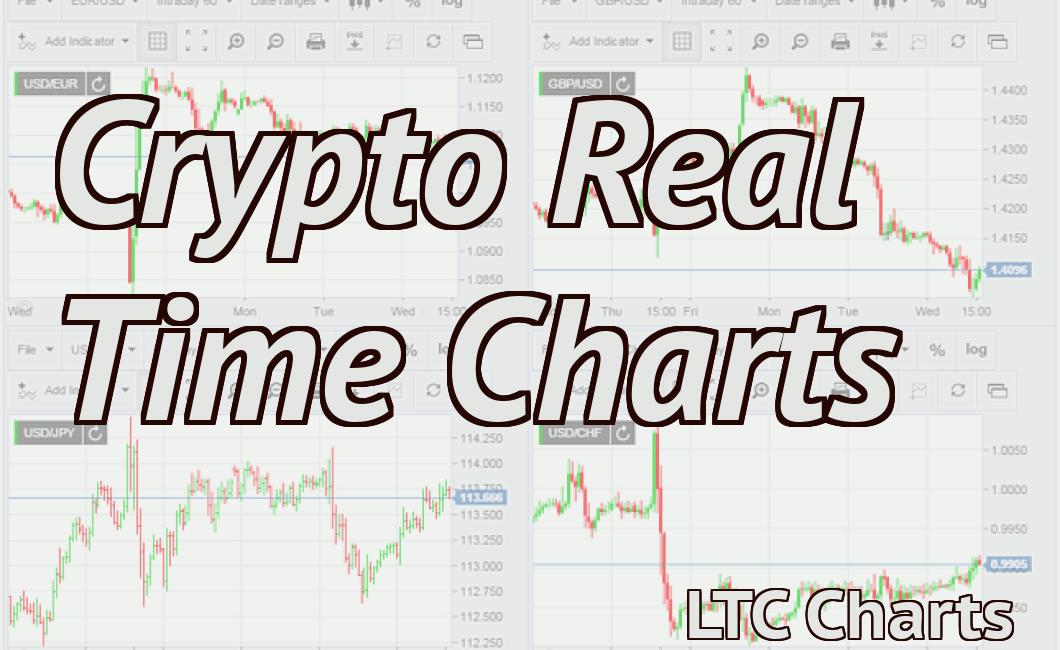
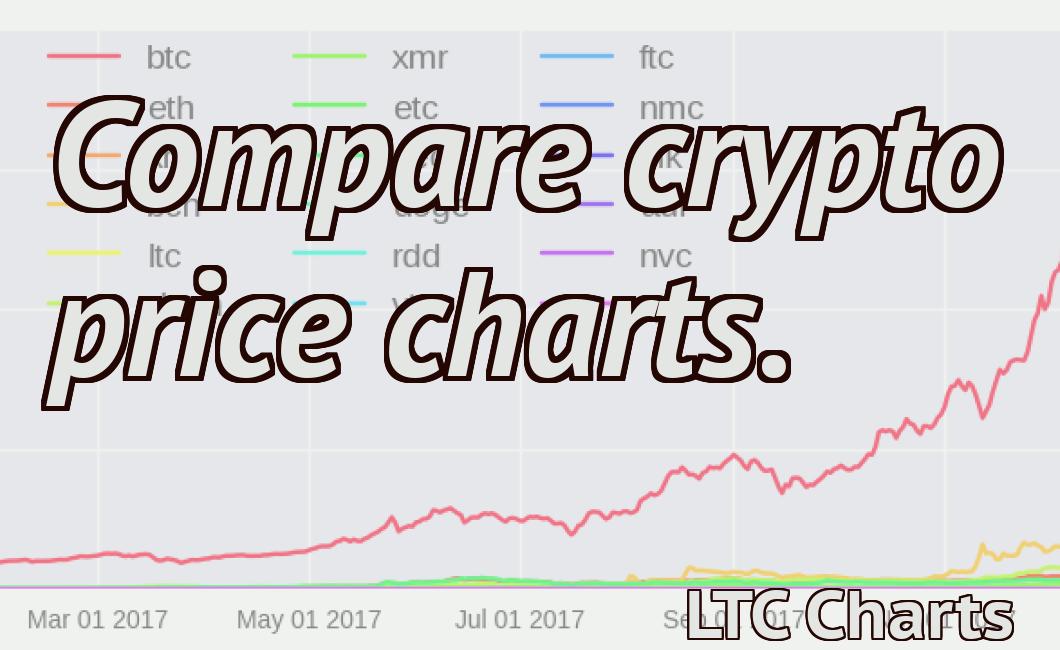
How to read charts for cryptocurrency.
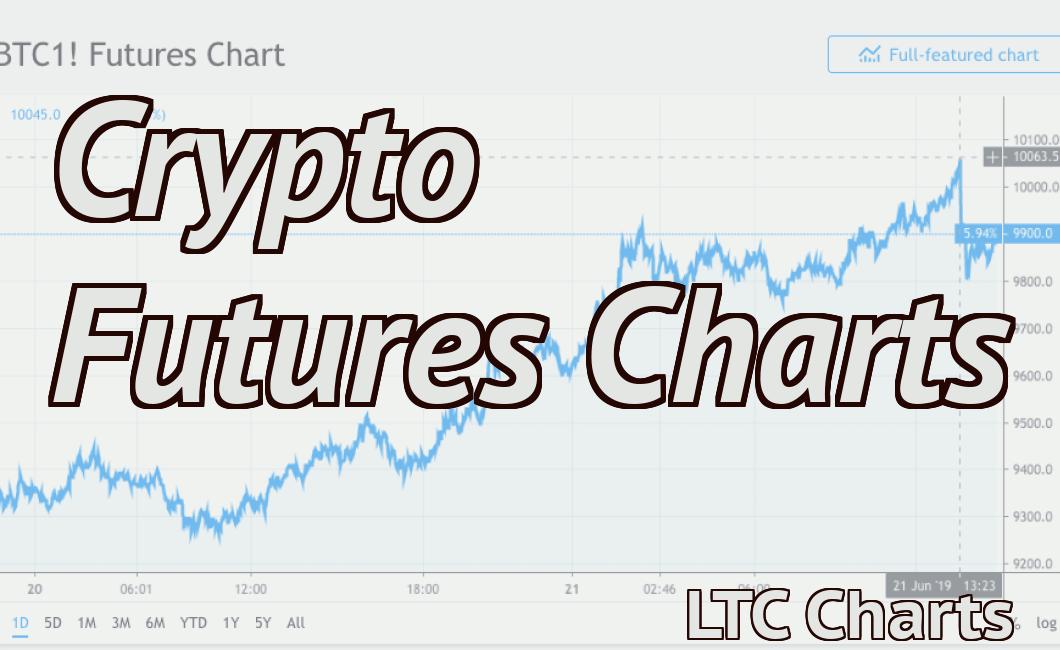
Cryptocurrency is a digital or virtual currency that uses cryptography for security. Cryptocurrencies are decentralized, meaning they are not subject to government or financial institution control. Bitcoin, the first and most well-known cryptocurrency, was created in 2009. Since then, numerous other cryptocurrencies have been created. These are often referred to as altcoins, short for alternative coins. Cryptocurrencies are often traded on decentralized exchanges and can also be used to purchase goods and services. To read charts for cryptocurrency, one must first understand the basic principles of technical analysis. Technical analysis is a method of predicting price movements by studying past market data, primarily price and volume. There are many different technical indicators that can be used when studying cryptocurrency charts. Some of the most popular indicators include moving averages, support and resistance levels, and trendlines. When studying cryptocurrency charts, it is important to remember that prices are constantly changing. As such, it is important to use multiple timeframes when analyzing charts. For example, a trader might look at a 1-hour chart to determine the overall trend and then use a 15-minute chart to identify potential entry and exit points.
How to Read Charts for Crypto Trading
There are a few different ways to read charts for cryptocurrency trading.
Timing the Market - One of the most important things you can do when trading cryptocurrencies is to try and time the market. This means understanding when the prices of different coins are at their highest and lowest points, and acting on that information.
Technical Analysis - Another key element of cryptocurrency trading is technical analysis. This involves studying charts to see if a particular coin is in a uptrend or downtrend, and trying to time your trades based on that information.
Building a Position - Another important aspect of cryptocurrency trading is building a position. This means buying a certain amount of a coin, and holding onto it until the price rises above your initial purchase price.
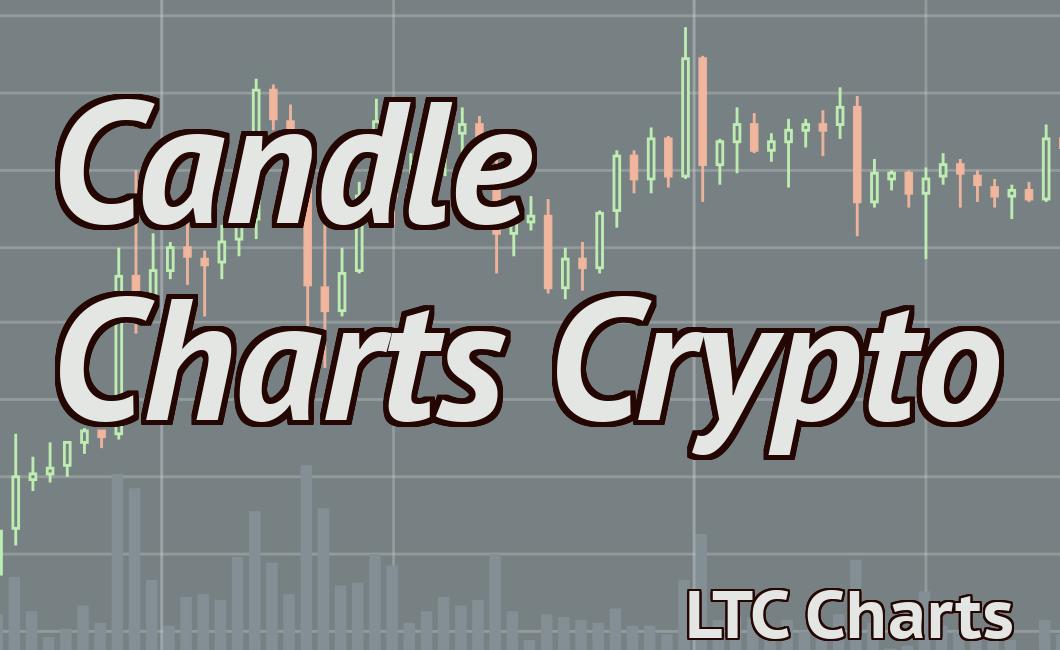
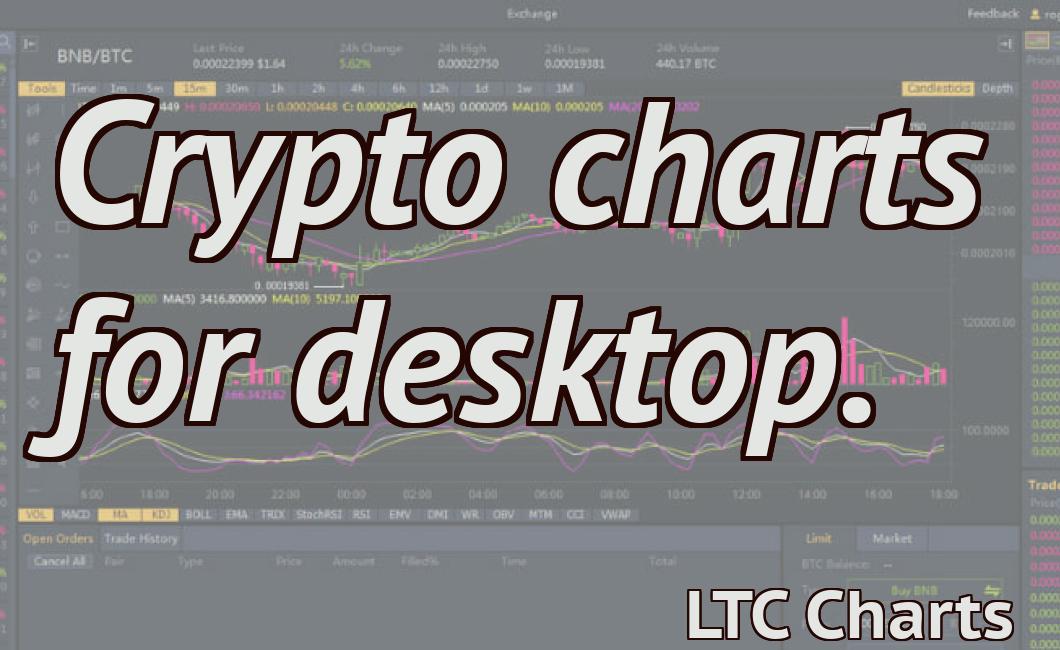
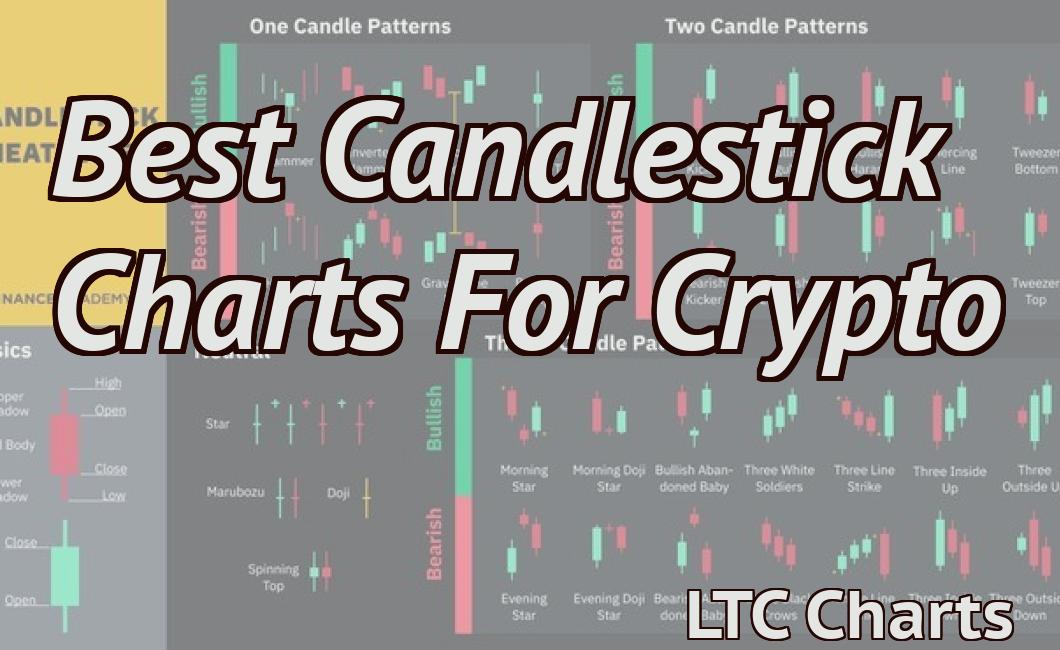
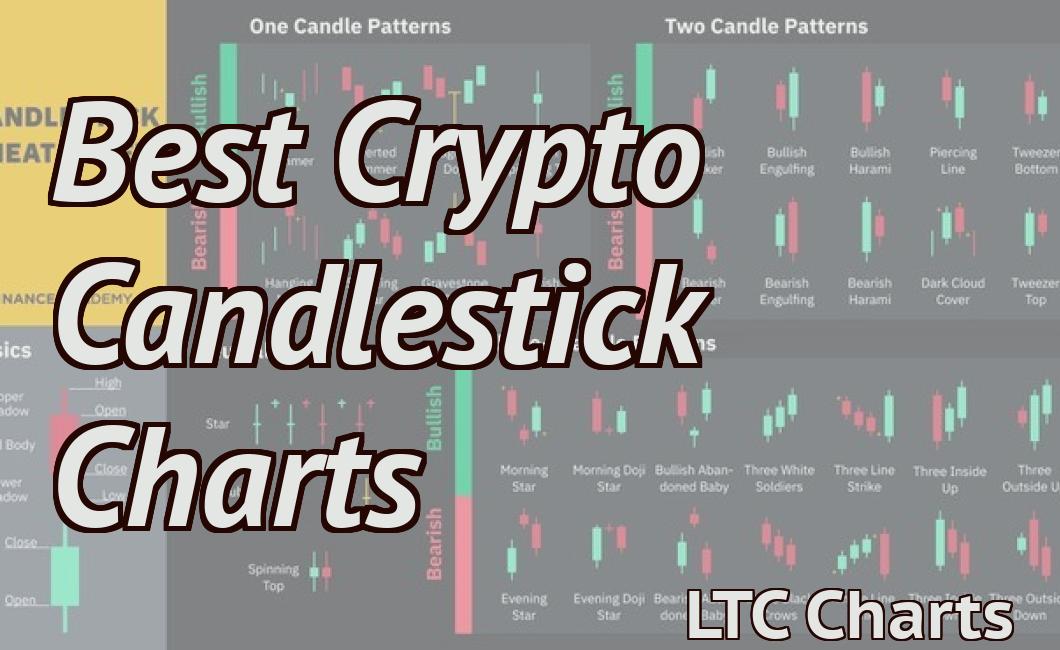
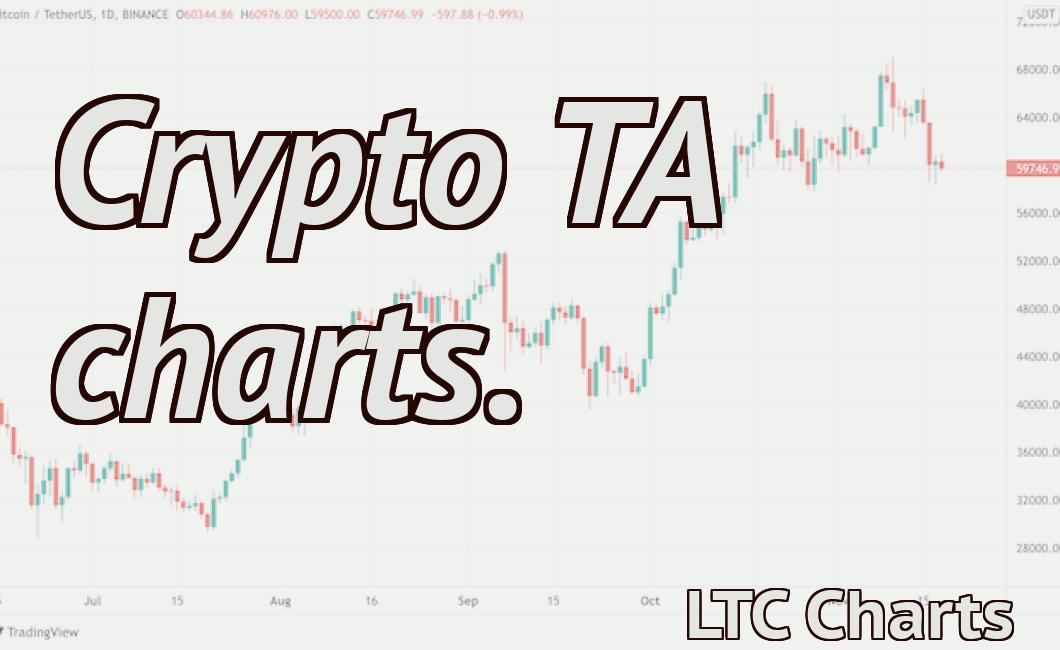
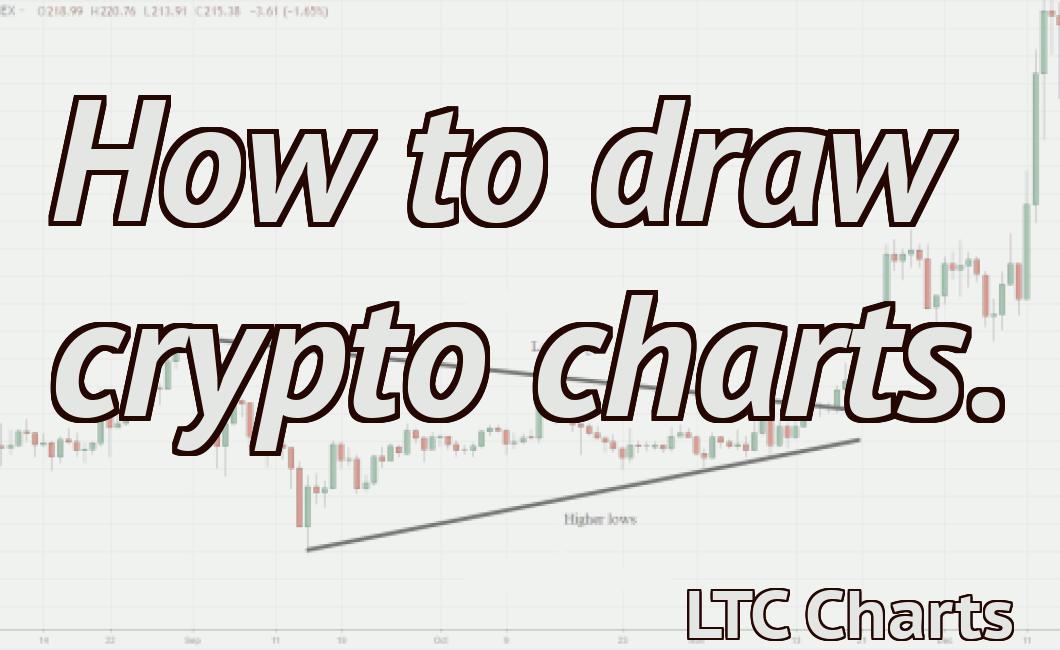
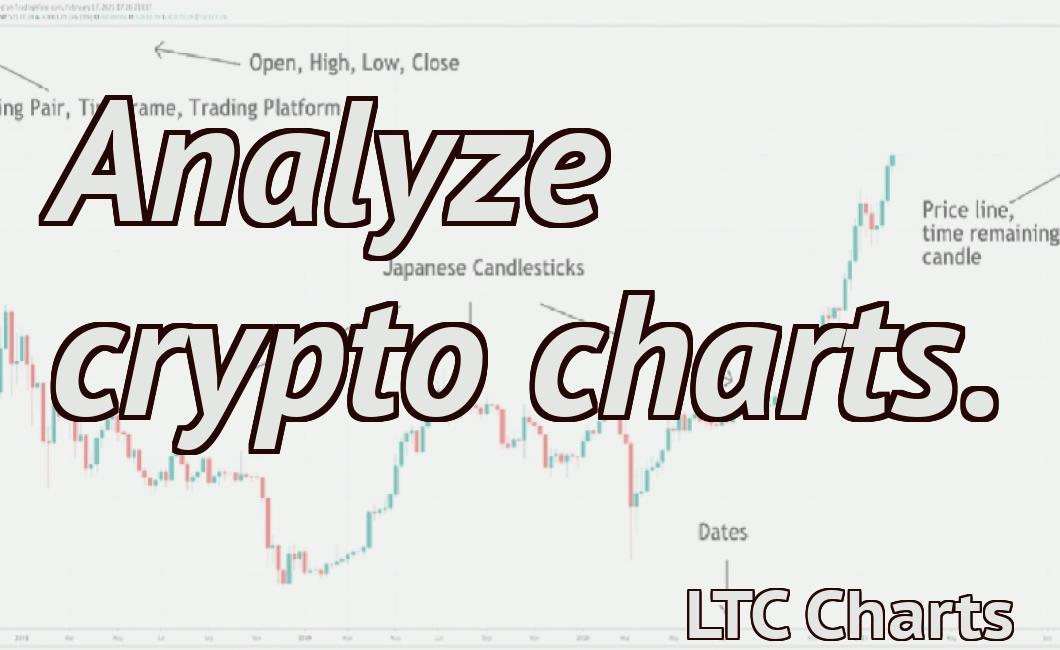
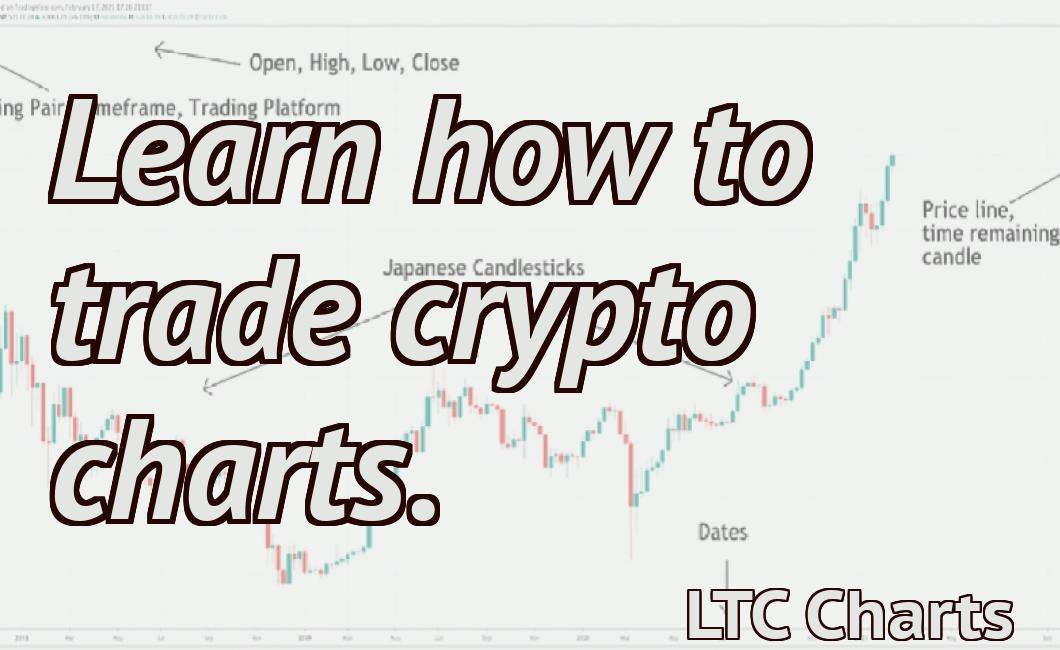
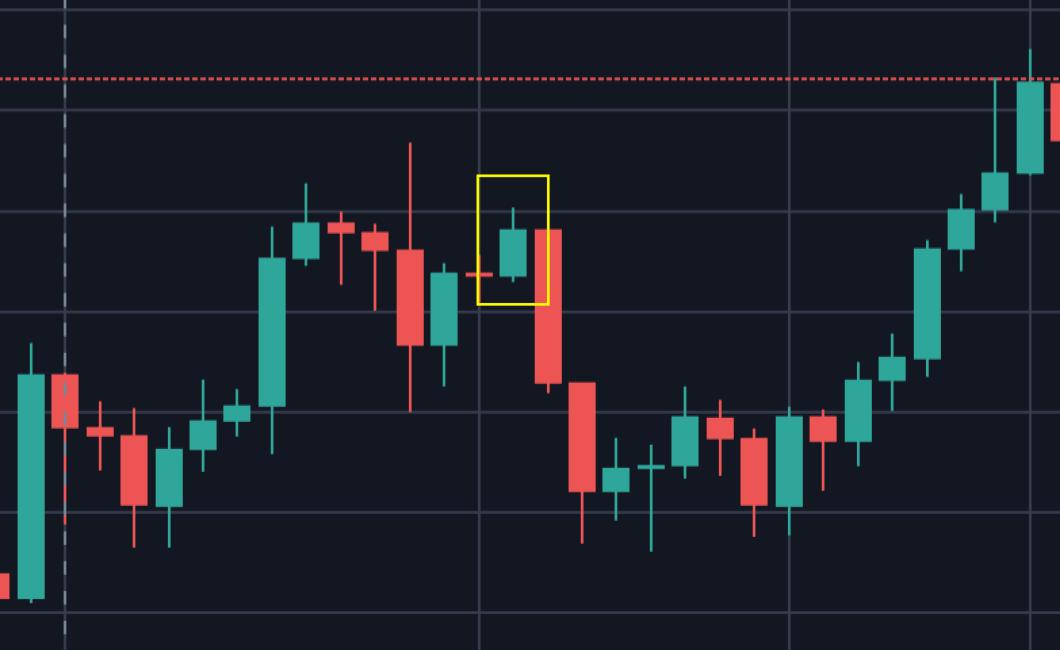
How to Use Candlestick Charts for Crypto Trading
Candlestick charts are a popular way to visualize financial data. They are used to display the prices of assets over time. When you are trading cryptocurrencies, candlestick charts can be helpful in understanding how price movements are related to one another.
To use candlestick charts for crypto trading, first find the currency you are trading and the timeframe you want to use. For example, if you are trading Bitcoin, you would use the BTC/USD chart.
Once you have found the chart, you will need to open it in a separate window. Next, you will need to find the candles. A candle is a graphical representation of a trade. To find a candle, click on the "candles" button on the left side of the chart. This will open a new tab with a list of all the candles on the chart.
To begin trading, simply find the candle that matches your desired price point and click on it. This will open the order window for that candle. You will now need to enter the order quantity and the price you wish to buy or sell at. Once you have entered your information, hit the "buy" or "sell" button.
candlestick charts are a popular way to visualize financial data. They are used to display the prices of assets over time. When you are trading cryptocurrencies, candlestick charts can be helpful in understanding how price movements are related to one another.
To use candlestick charts for crypto trading, first find the currency you are trading and the timeframe you want to use. For example, if you are trading Bitcoin, you would use the BTC/USD chart.
Once you have found the chart, you will need to open it in a separate window. Next, you will need to find the candles. A candle is a graphical representation of a trade. To find a candle, click on the "candles" button on the left side of the chart. This will open a new tab with a list of all the candles on the chart.
To begin trading, simply find the candle that matches your desired price point and click on it. This will open the order window for that candle. You will now need to enter the order quantity and the price you wish to buy or sell at. Once you have entered your information, hit the "buy" or "sell" button.
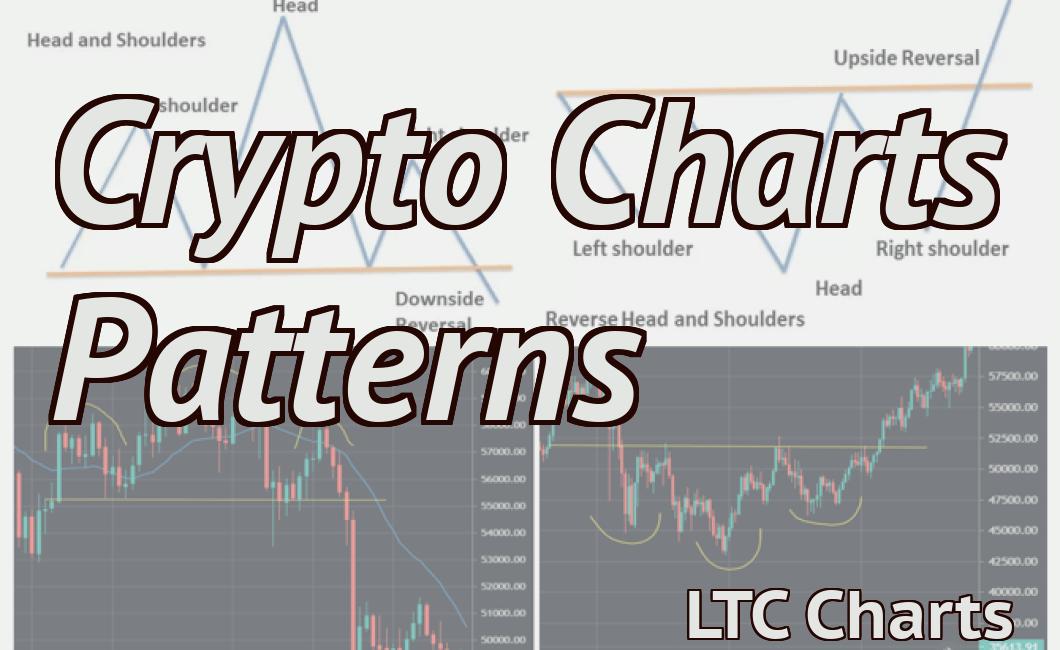
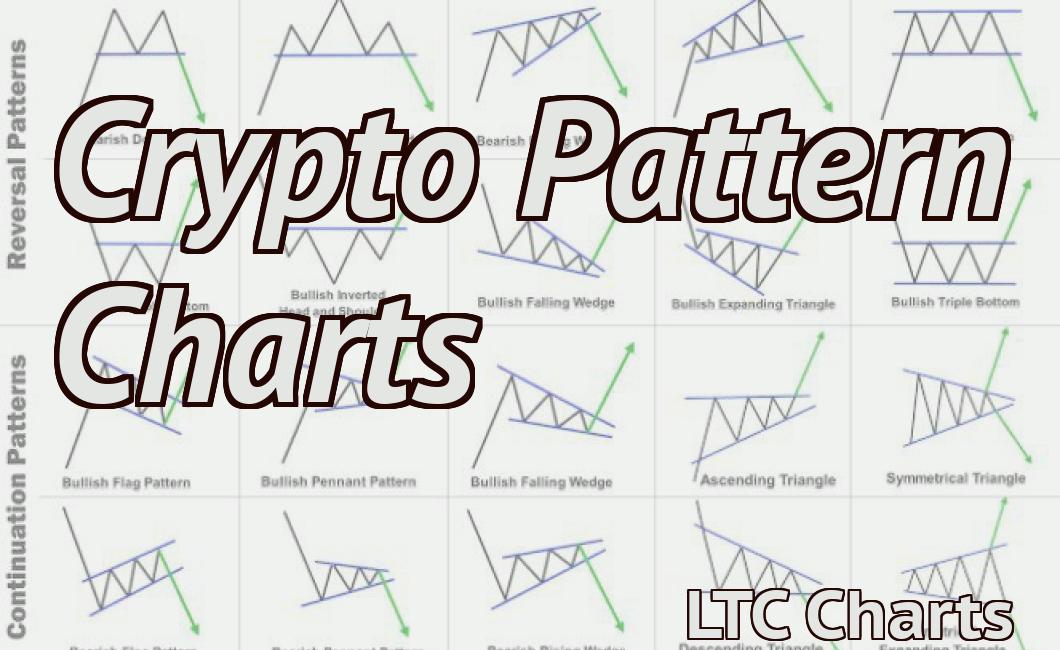
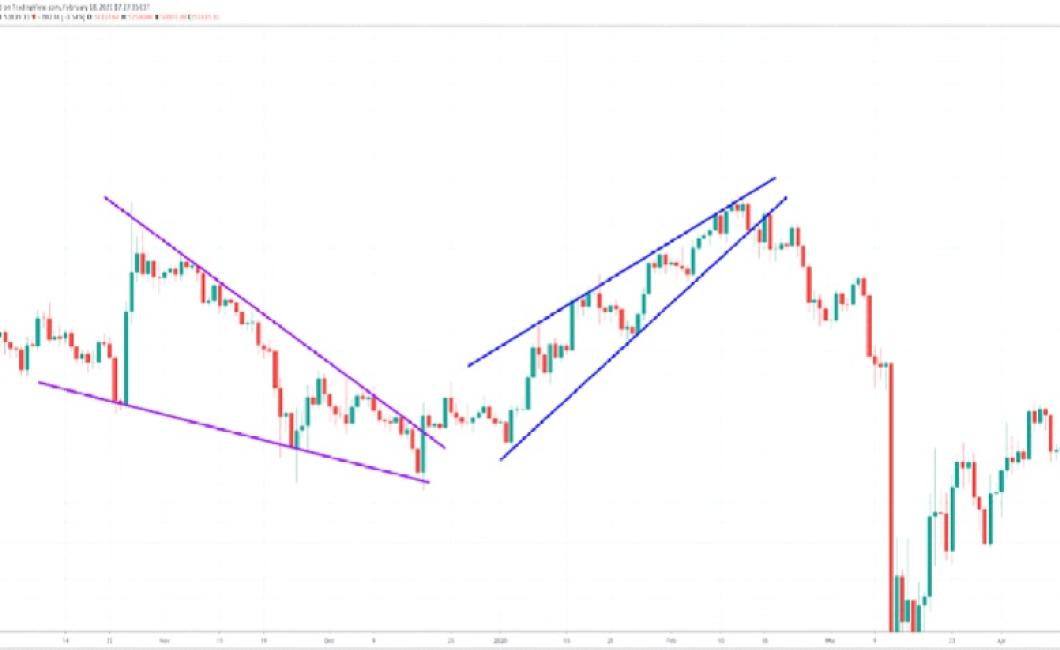
How to Identify Key Support and Resistance Levels in Crypto Charts
The support and resistance levels in crypto charts are important indicators that can help traders determine when and where to buy or sell cryptocurrencies.
The support level is the lowest price at which a cryptocurrency has been traded for a period of time. If the price of a cryptocurrency falls below the support level, it is likely that buyers will enter the market and push the price up.
The resistance level is the highest price at which a cryptocurrency has been traded for a period of time. If the price of a cryptocurrency falls below the resistance level, it is likely that sellers will enter the market and push the price down.
How to Use Technical Indicators in Crypto Charts
Technical indicators are used to give an indication of the health of a market. There are many technical indicators available, but some of the most commonly used ones include the Bollinger Bands, the MACD, and the RSI.
To use technical indicators in your crypto charts, first find the indicator you want to use. Once you have found it, add it to your chart and set its parameters. Next, watch the chart and look for patterns. When you see a pattern, use that information to adjust the indicator’s settings.
How to Read Order Books in Crypto Charts
There are a few different ways to read order books in crypto charts.
The first way is to look at the total amount of buy and sell orders that are currently open. This can help you see which coins are being most actively traded and therefore may be more likely to experience price volatility.
The second way is to look at the current prices of the coins being traded. This can help you see which coins are experiencing the highest or lowest prices, and may provide a better indication of where the price of a cryptocurrency is likely to go in the future.
The third way is to look at the volume of trade activity for each coin. This can help you see which coins are being traded the most and may provide you with an indication of where the price of a cryptocurrency is likely to go in the future.
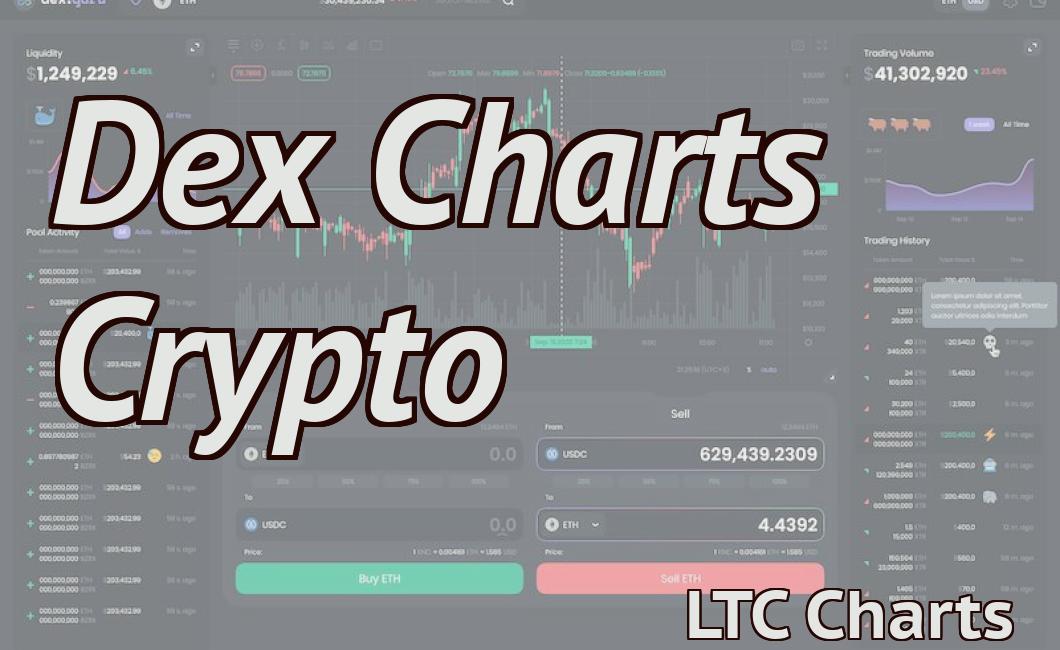
How to Use Depth Charts in Crypto Trading
There are a few ways to use depth charts in crypto trading.
The first way is to use them as a way to monitor the market conditions. By looking at the different depths of the chart, you can see how the market is behaving and what the possible trend might be.
The second way to use depth charts is to find specific movements. By looking at the different depths of the chart, you can see where the market is moving and if there are any specific points of interest.
The third way to use depth charts is to find opportunities. By looking at the different depths of the chart, you can see where the market is moving and if there are any potential buy or sell points.
How to Trade Range-bound Markets with Crypto Charts
When trading range-bound markets, it’s important to keep an eye on the crypto charts in order to identify potential opportunities. Crypto charts can provide valuable information about the state of the market, and can help you identify when a market is about to breakout or breakdown.
To trade range-bound markets effectively, it’s important to have a clear understanding of the following concepts:
1. Supply and Demand
2. Support and Resistance
3. Fibonacci Retracements
4. Price Action
5. Trendlines
When trading range-bound markets, it’s important to keep an eye on the following indicators:
1. The crypto charts
2. The Moving Averages
3. The MACD
4. The RSI
5. The Volume Indicator