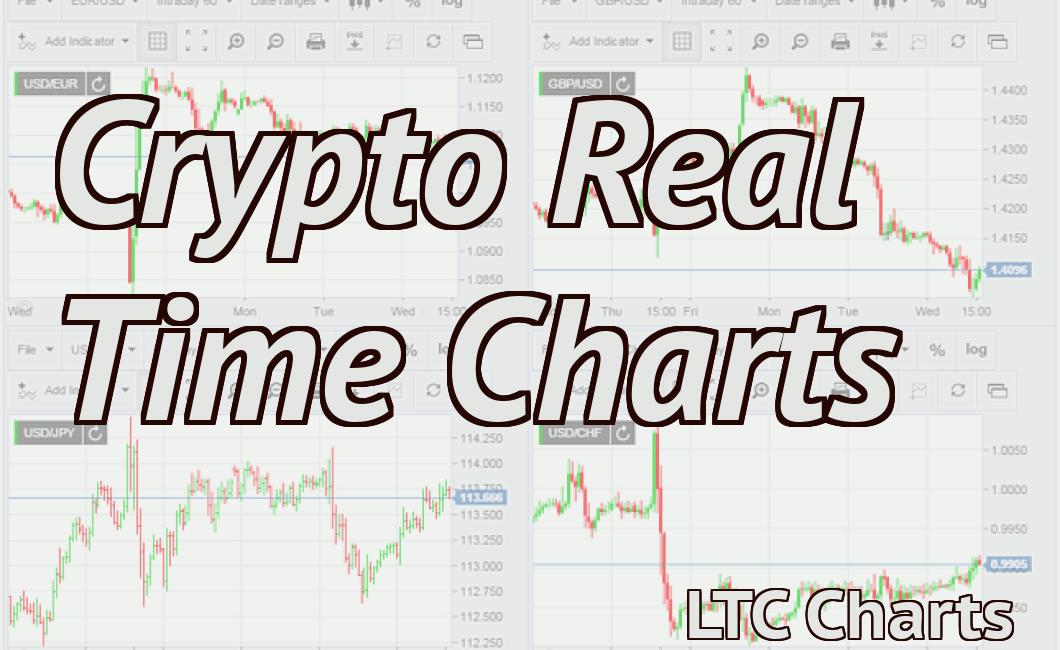
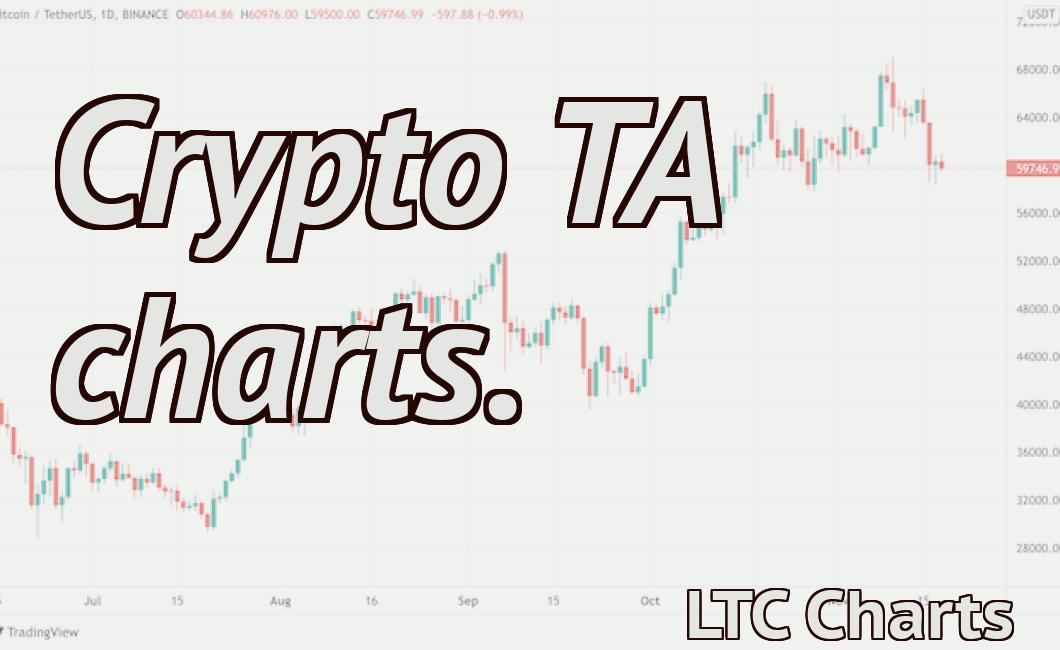
How to read crypto charts.
This article will teach you how to read crypto charts so that you can make better informed investment decisions. You will learn about the different types of charts and how to interpret them. You will also learn about common charting patterns and indicators.
How to read charts for crypto trading
There are a few things to keep in mind when reading charts for cryptocurrency trading.
1. Technical analysis is the process of studying technical indicators in order to make informed investment decisions.
2. When looking at a chart, always keep in mind the following:
-The chart is a graphical representation of past price action.
-It is not a prediction of future price action.
-The information on the chart is accurate as of the time it was compiled. However, future events may affect the accuracy of the information.
-Always consult with a professional before making investment decisions.
3. When looking at a chart, always consider the following factors:
-The trend – What is happening on the chart? Is the market trending up, down, or stable?
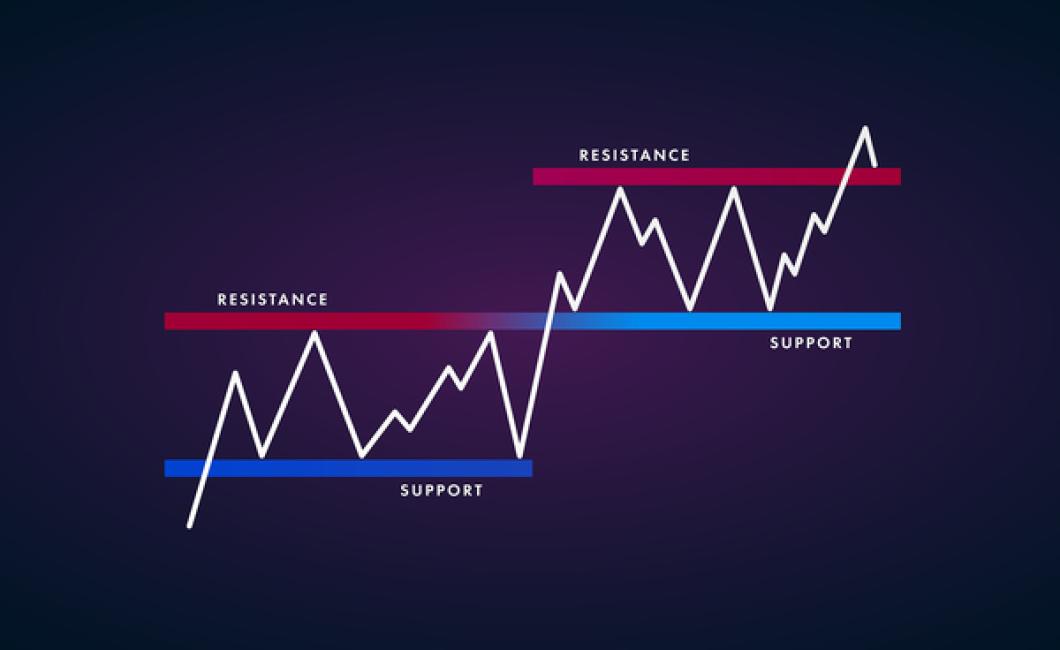
-Support and resistance levels – Where does the market seem to be hitting strong resistance and then finding support? These levels can provide valuable clues about where buyers and sellers are congregating.
-Volume – How active is the market? Are a lot of buyers or sellers present? This can give you clues about when to buy or sell.
The most important things to look for when reading crypto charts
When looking at crypto charts, the most important thing to look for is the price movement. This will give you an idea of how the cryptocurrency is doing and whether or not there are any signs of a potential trend.
Another important thing to look for on crypto charts is the volume. This will give you an idea of how active the market is and whether or not there are any signs of instability.
Finally, pay attention to the support and resistance levels. These are important indicators of where the market is likely to go next and can be a good way to determine when it might be a good time to invest in a cryptocurrency.
3 things you need to know about reading crypto charts
1. Crypto charts are a great way to get an overview of the current state of the market.
2. They can be a useful tool for gauging the strength of a particular cryptocurrency.
3. Crypto charts can be a useful way to find new opportunities in the market.
How to read crypto charts like a pro
Crypto charts are a great way to get a sense for the price of a particular cryptocurrency at any given time. For example, if you’re interested in buying Bitcoin, you can use a crypto chart to see how the price of Bitcoin has changed over the past day, week, or month.
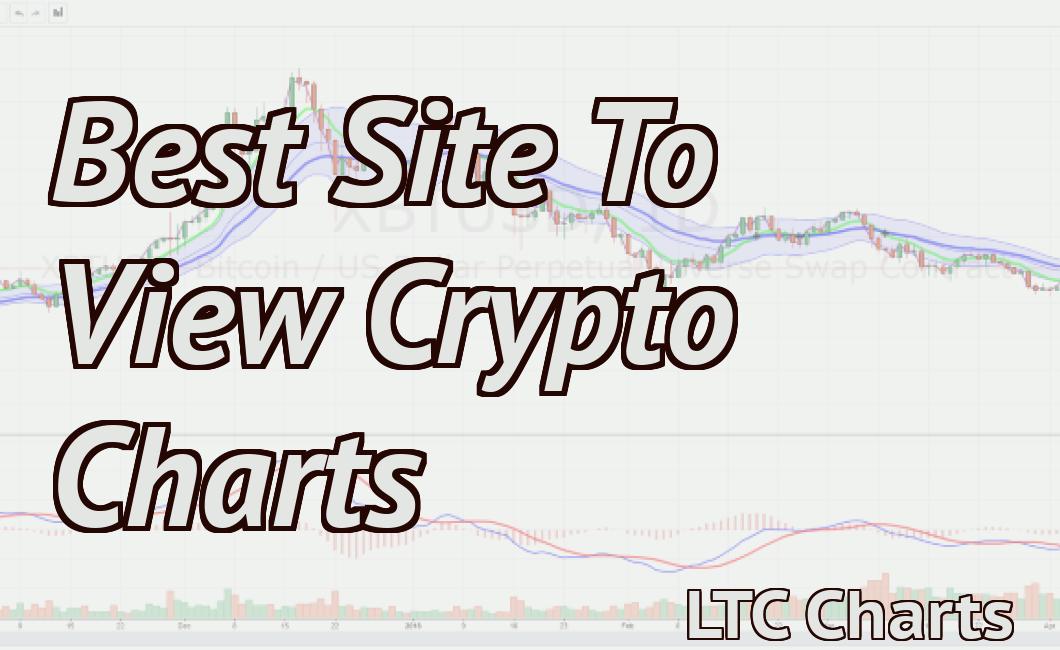
The first thing you need to do is find a good crypto charting platform. There are a number of options available, including CoinMarketCap, Coincap, and Bitfinex. Once you’ve found a platform, you need to sign up for an account.
Once you have an account, you need to find the cryptocurrency you want to track. You can do this by either searching for the name of the cryptocurrency on the platform you’ve chosen, or by using the “coin” filter on CoinMarketCap.
Once you’ve found the cryptocurrency you want to track, you need to find the “coin” tab on the platform you’ve chosen. This will show you all of the cryptocurrencies that are being traded on that platform.
Next, you need to find the “cryptocurrency chart” tab. This will show you a graph of the prices of the cryptocurrency over the past few hours, days, or weeks.
Once you’ve found the cryptocurrency chart, you need to find the “ candles ” tab. This will show you the current price and the volume of the cryptocurrency over the past few hours, days, or weeks.
Finally, you need to find the “historical data” tab. This will show you the price and volume of the cryptocurrency over the past few months or years.
How to make sense of crypto charts
Cryptocurrencies are often traded on decentralized exchanges, which makes it difficult to understand their movements. Cryptocurrency charts make it easier to see how prices are changing over time and to predict where prices may go next.
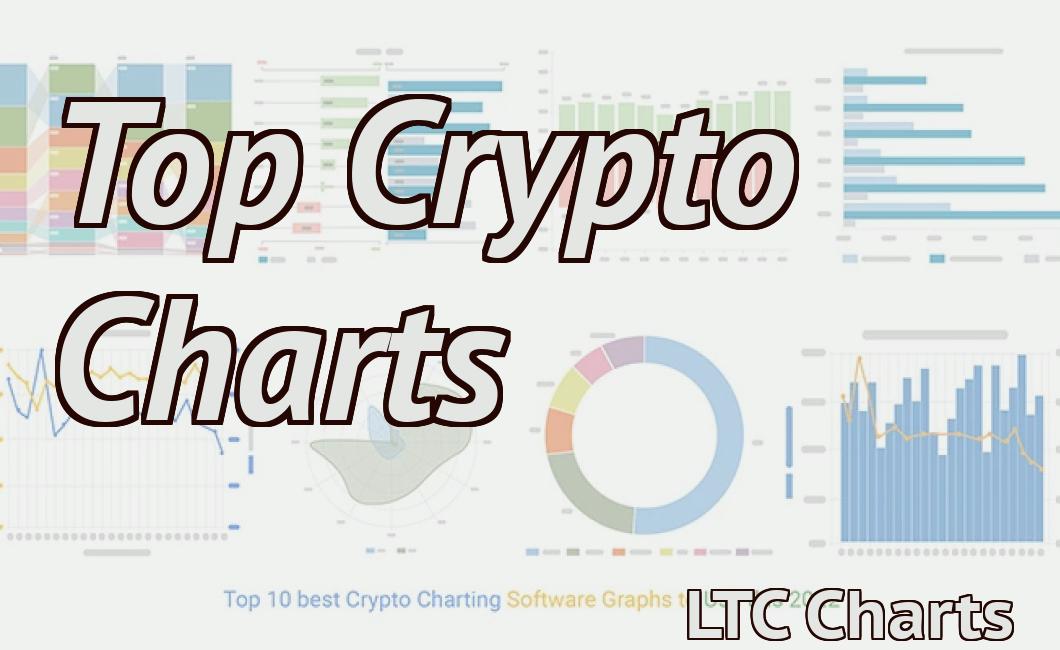
There are a few different types of crypto charts that can be used to better understand the market:
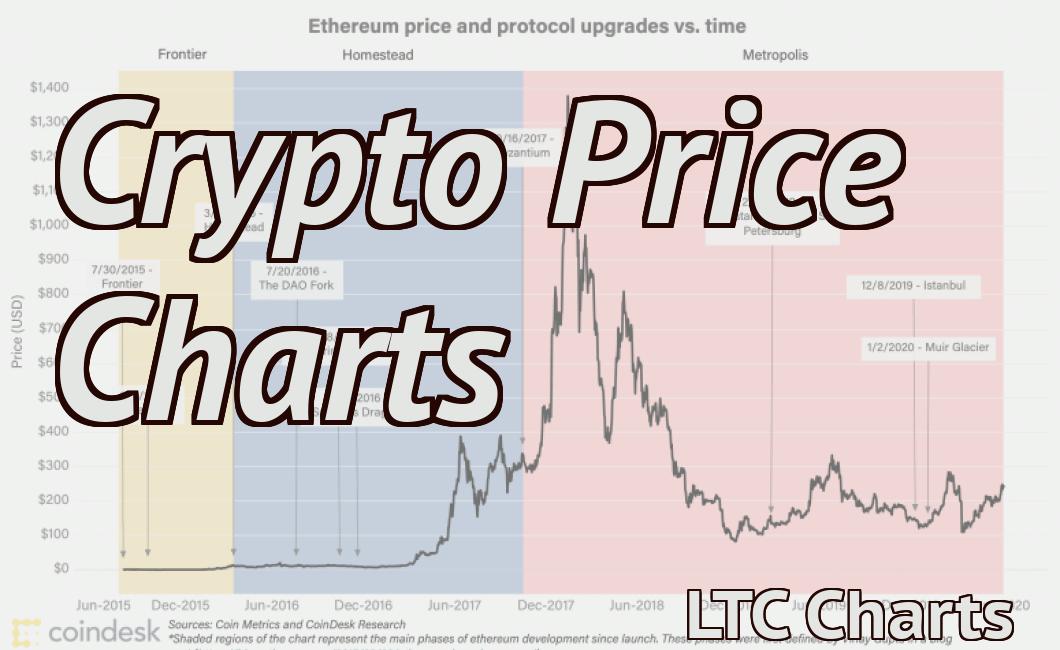
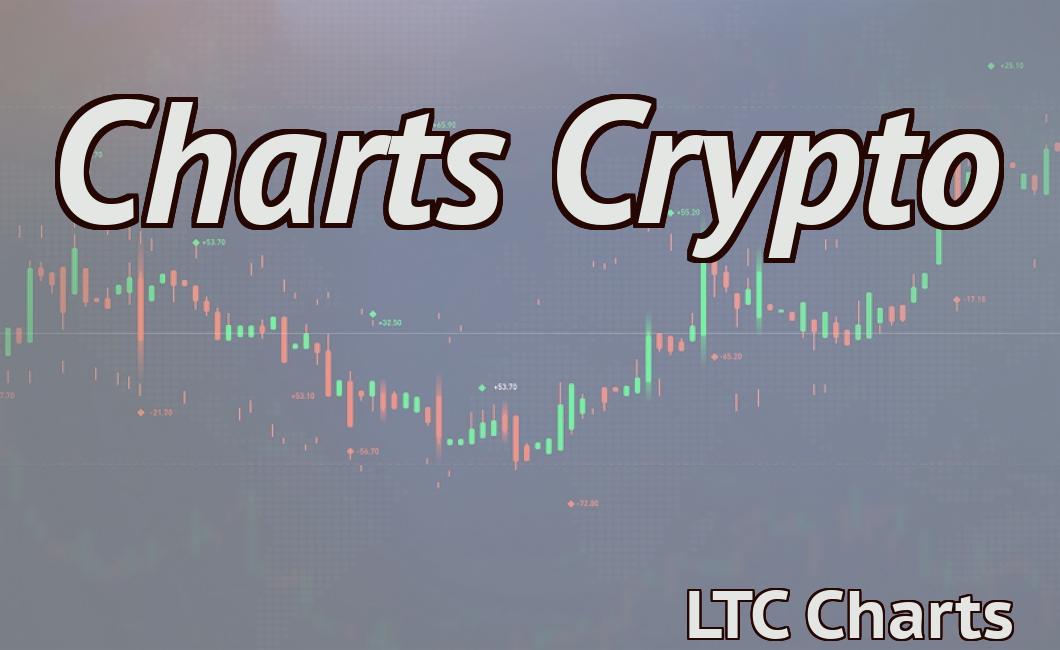
1. Price chart
A price chart shows the relative price of a cryptocurrency over time. This can be helpful in understanding how the market is performing and in predicting where prices may go next.
2. Volume chart
A volume chart measures the total amount of cryptocurrency that has been exchanged over a given period of time. This can be helpful in understanding how active the market is and in predicting where prices may go next.
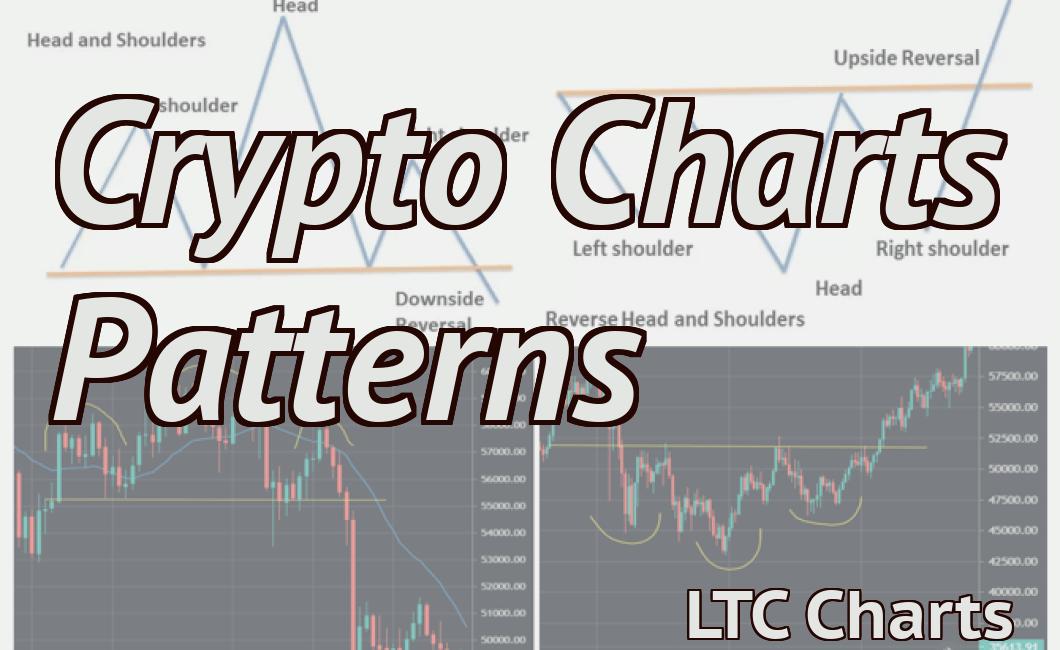
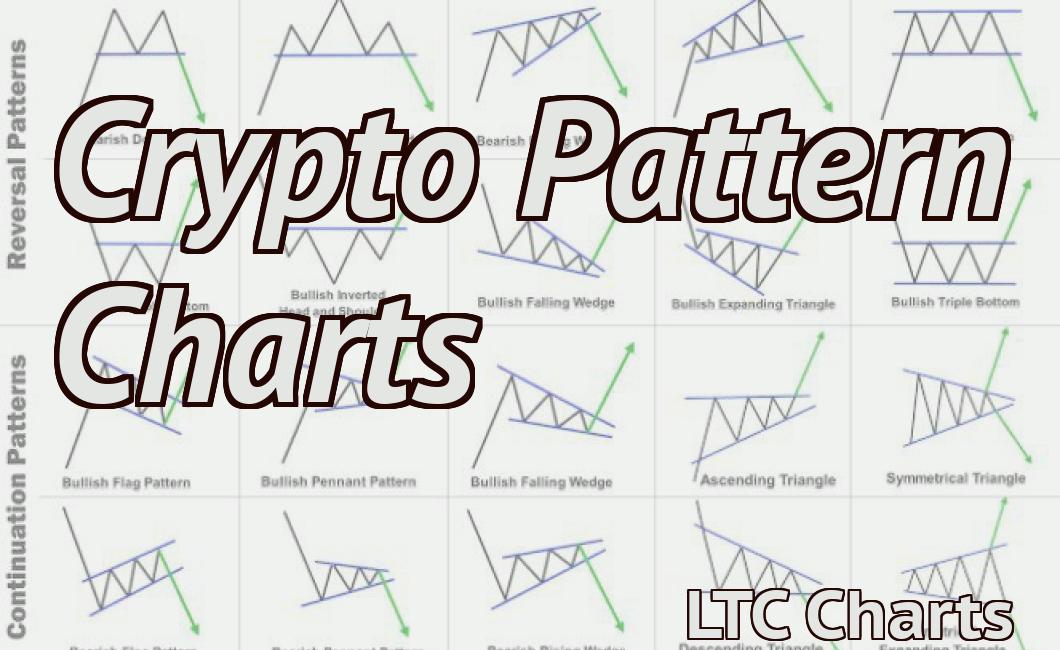
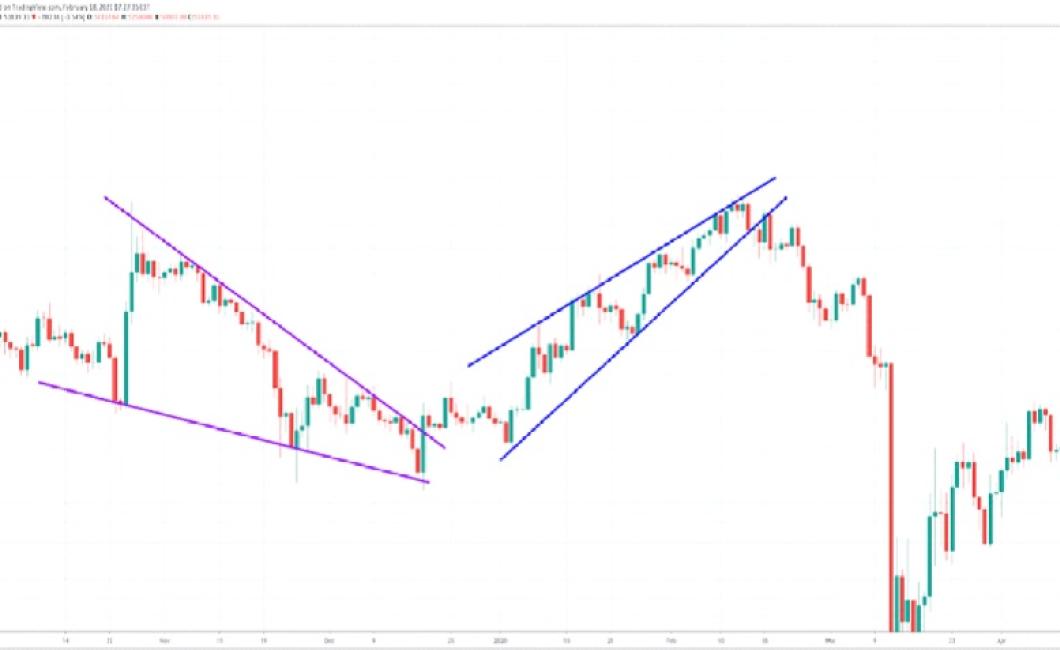
3. Chart pattern
Chart patterns are specific formations that can be found on cryptocurrency charts. They can be used to identify potential areas of growth or weakness in the market.
Once you have understood the different types of crypto charts, you can use them to your advantage in order to make more informed investment decisions.
How to decipher crypto charts
Cryptocurrencies are often traded on different exchanges with different symbols. To make things easier, some popular exchanges that trade cryptocurrencies are Coinbase, Binance, and Bitfinex.
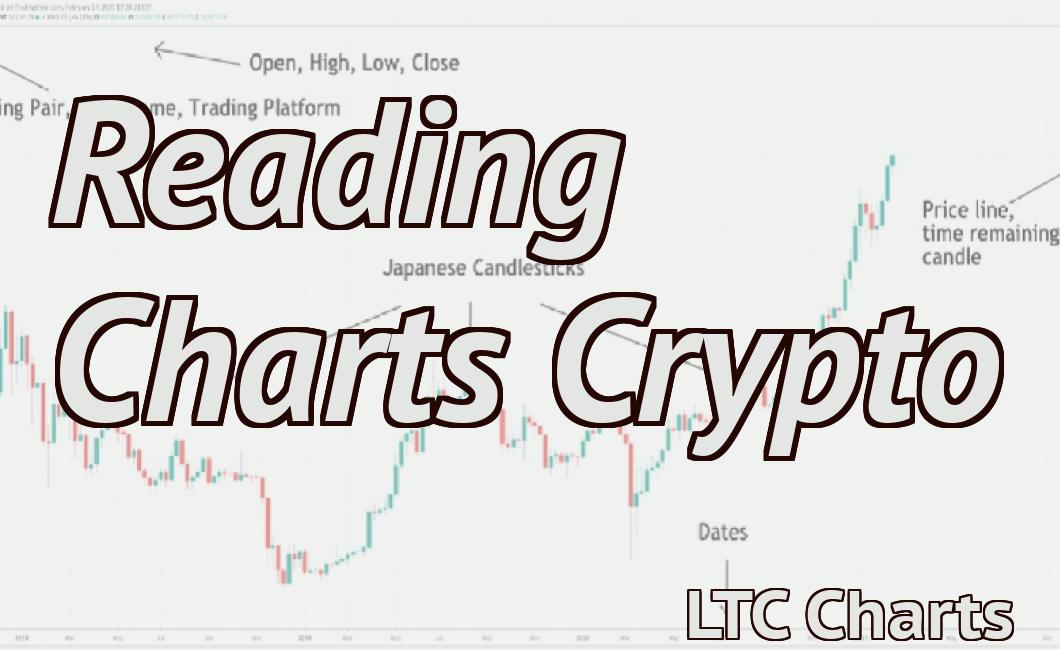
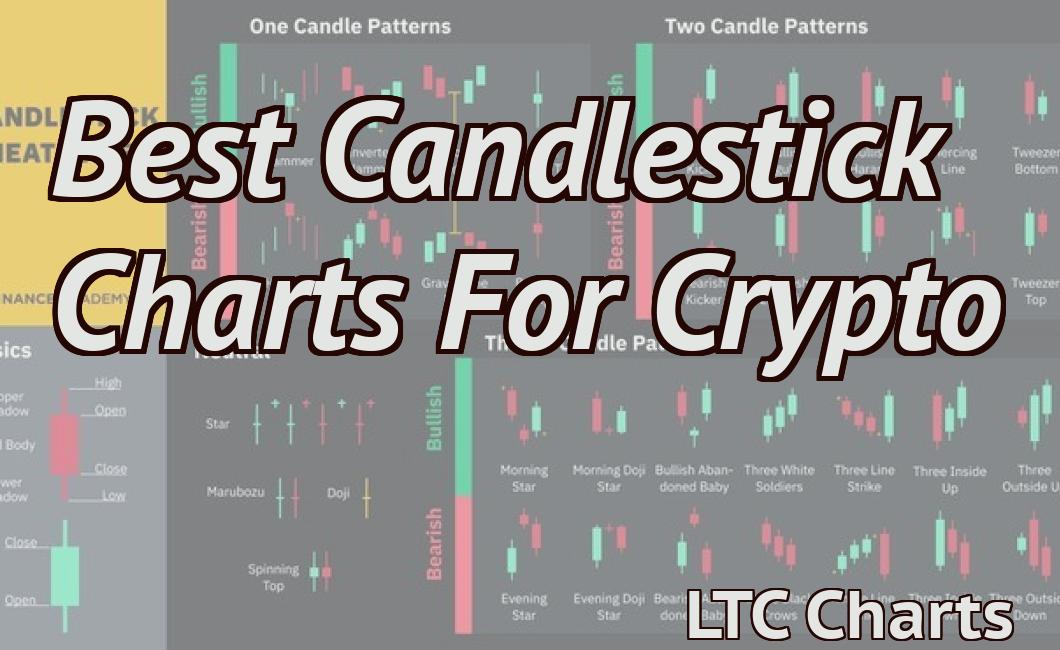
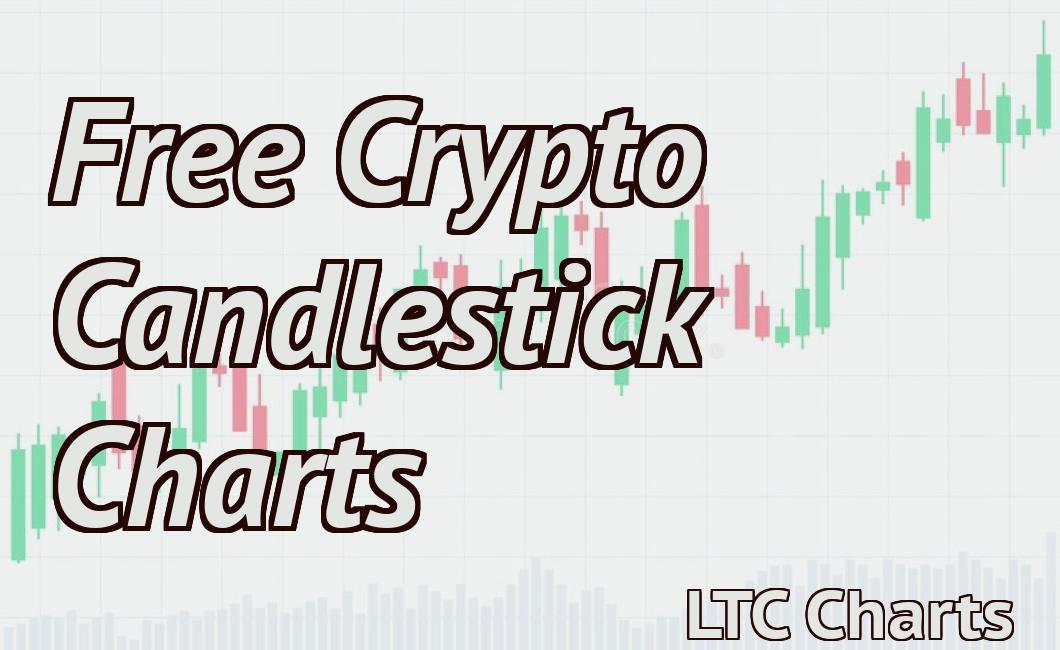
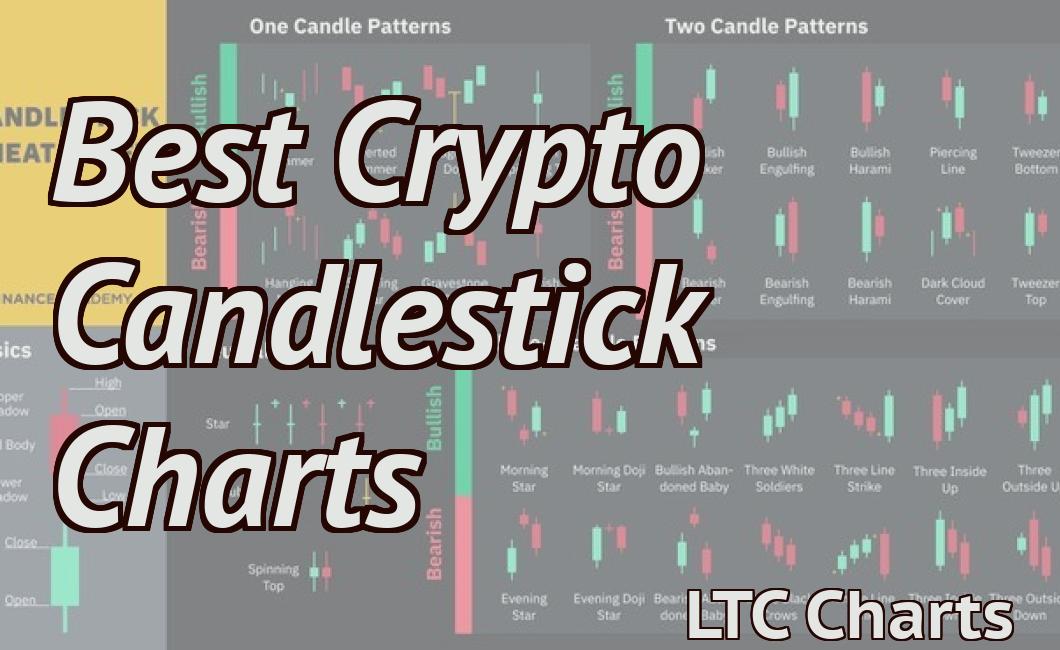
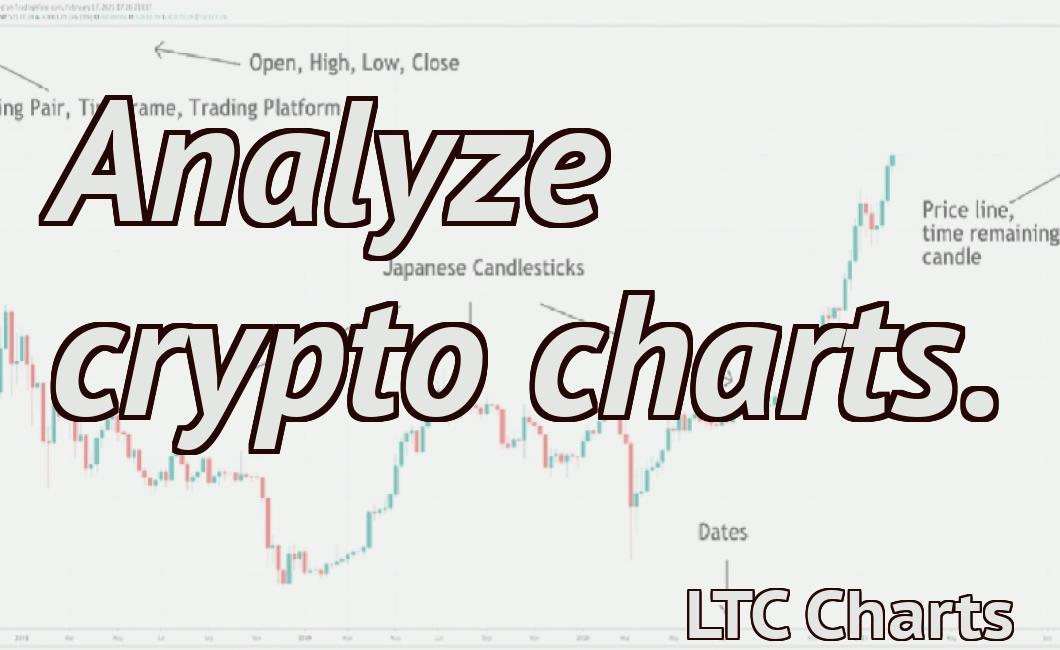
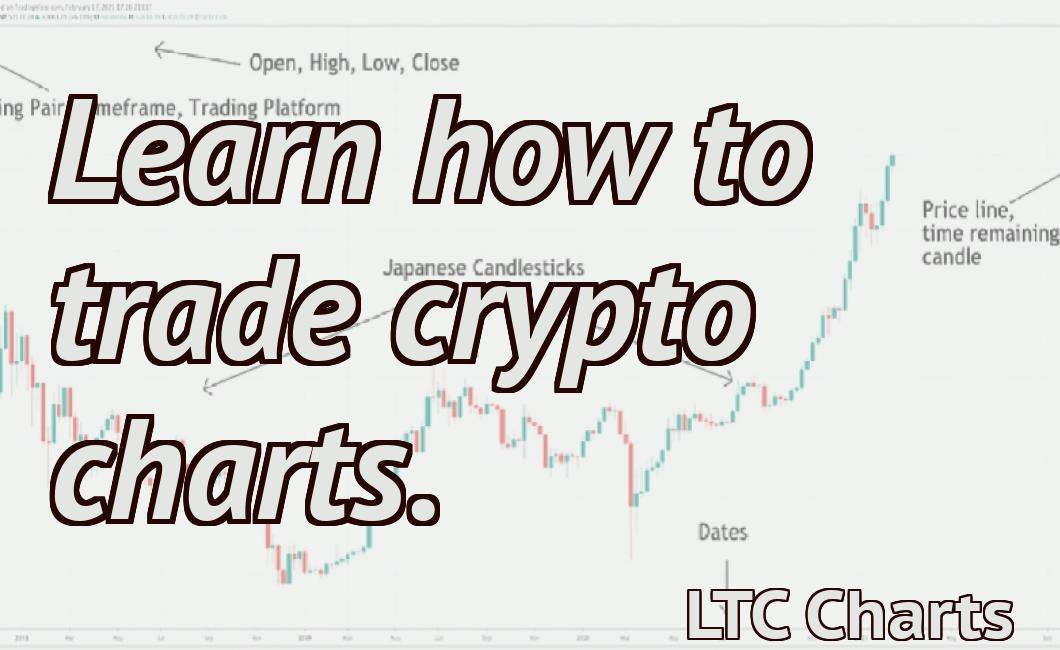
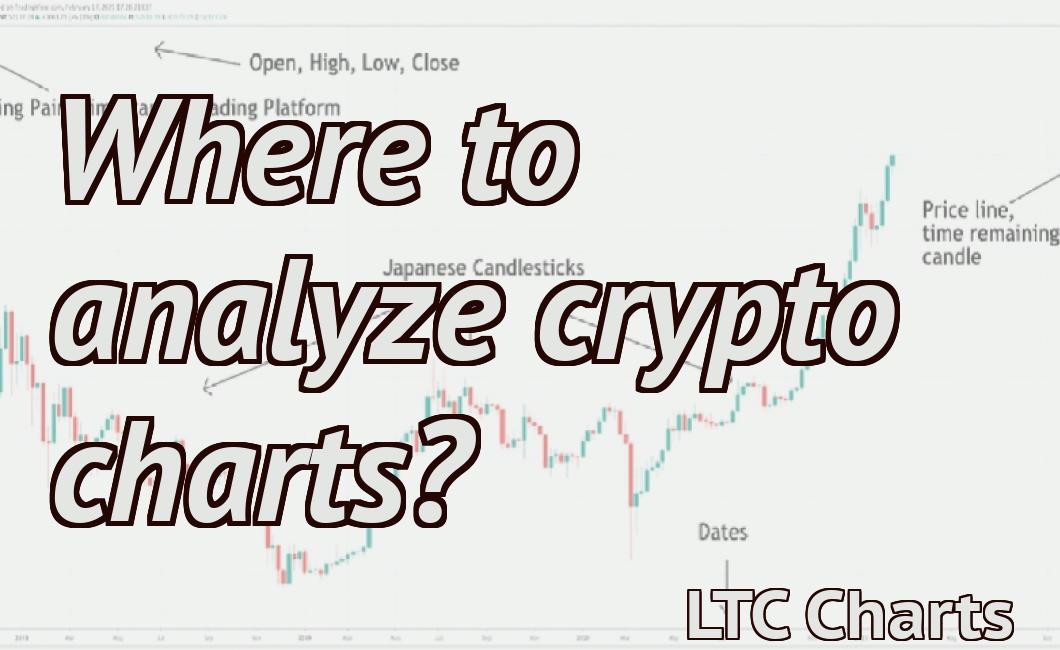
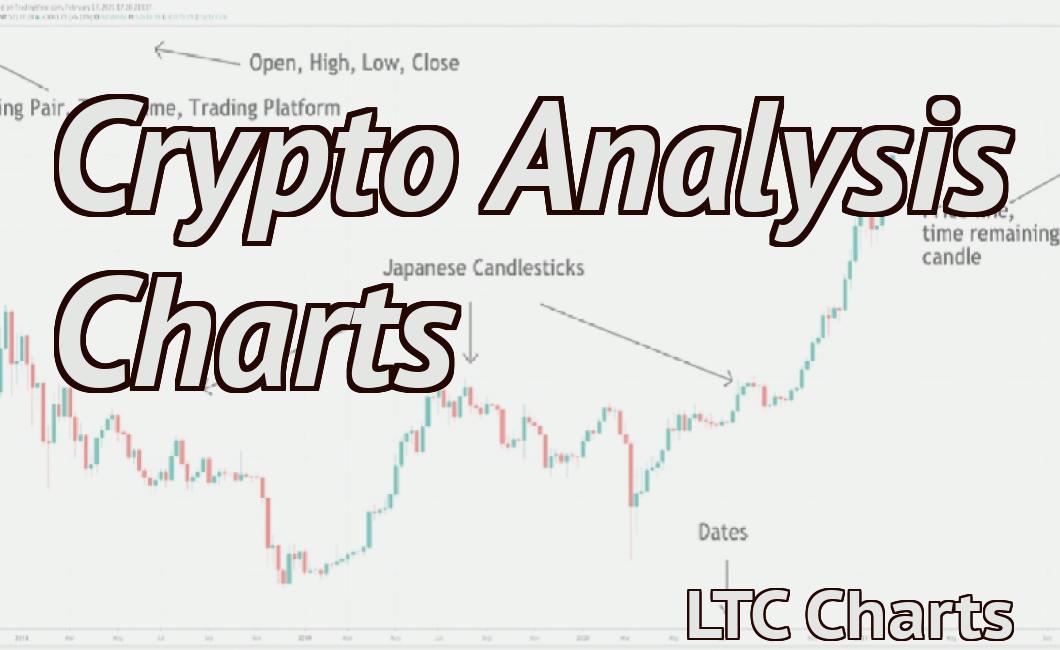
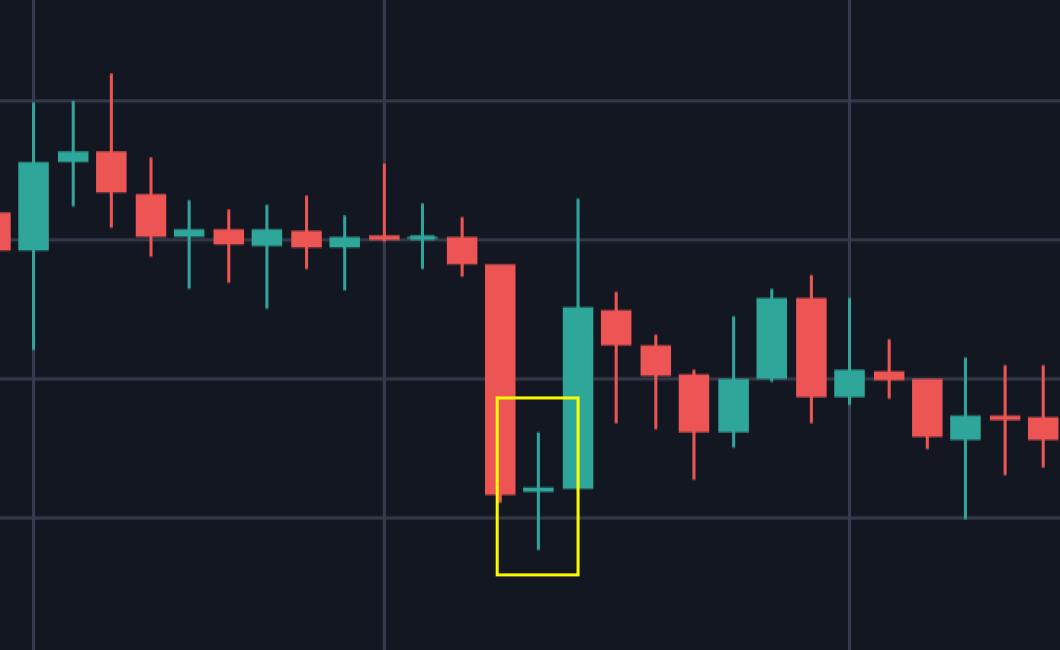
The most common way to chart cryptocurrencies is to use candlesticks. Candlesticks are a visual way of representing prices and are similar to the ones you see on financial charts.
The first thing you need to do is find the closing price for the day. This can be found on the exchanges' charts or by looking at the order books.
Next, you need to find the open and closing prices for the day. This can be found on the exchanges' charts or by looking at the order books.
Then, you need to find the high and low prices for the day. This can be found on the exchanges' charts or by looking at the order books.
To create a crypto candlestick, you first need to find the volume for the day. This can be found on the exchanges' charts or by looking at the order books.
You then need to find the candle's height (the value of the candlestick) and its width (the number of candles that make up the candlestick). Finally, you need to find the candle's color (either green, red, or blue).
For example, here is a crypto candlestick chart for Bitcoin:
How to crack the code of crypto charts
Cryptocurrency charts are a great way to track the performance of digital coins and tokens. However, not all cryptos are created equal and it can be difficult to identify the best investments. This guide will teach you how to crack the code of crypto charts and identify the best investments.
The first step is to assess your investment goals. Do you want to make short-term profits or do you want to hold onto your coins for the long term? Each coin and token has different strengths and weaknesses, so it is important to understand which ones are best suited for your goals.
Once you know your investment goals, you can begin to crack the code of crypto charts. The first step is to understand how the coins and tokens are traded. This information can be found on various cryptocurrency exchanges.
Next, you need to understand the dynamics of the market. This information can be found in cryptocurrency news articles and on various cryptocurrency forums. By understanding the market conditions, you can better determine when to buy and sell coins and tokens.
Finally, you need to understand the technology behind the coins and tokens. This information can be found on various cryptocurrency websites and in cryptocurrency whitepapers. By understanding the technology, you can better assess the long-term potential of the coins and tokens.
How to unlock the secrets of crypto charts
Cryptocurrency charts can be a valuable tool for understanding the market, but they can also be confusing. There are a lot of different types of charts and various ways to read them. This guide will explain how to unlock the secrets of crypto charts.
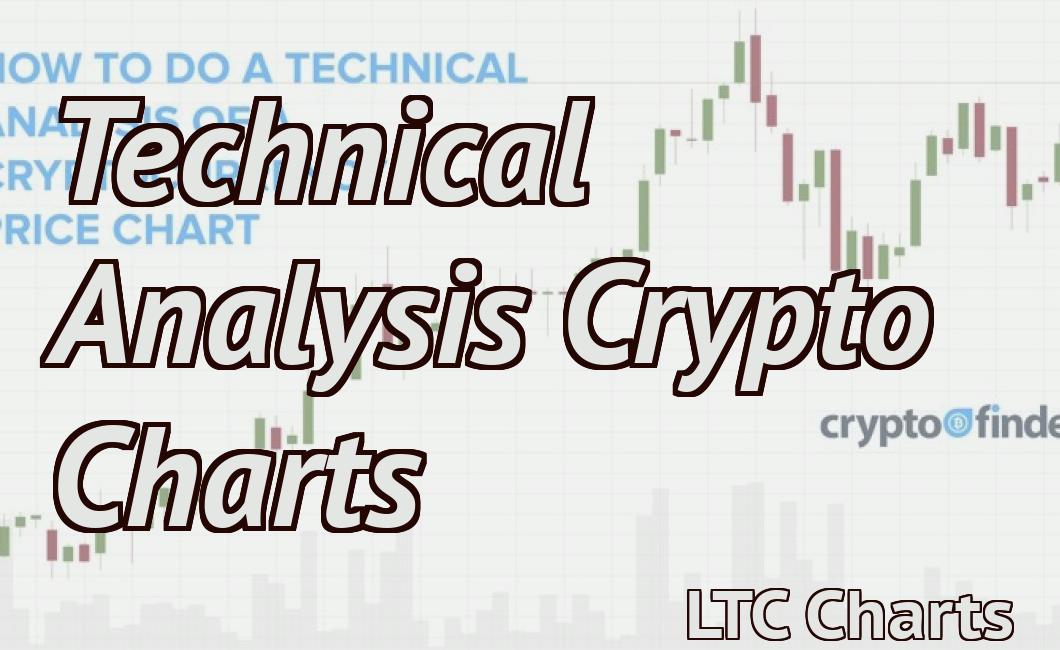
The first step is to understand the different types of charts. There are two main types of charts: technical and fundamental.
Technical charts are designed to show how the market is performing. They show prices and other data points over time.
Fundamental charts focus on the underlying factors that are driving the market. These charts track things like volume, price action, and sentiment. They can help you to understand the real reasons why the market is moving.
The next step is to understand how to read crypto charts.
The first thing to look for on a technical chart is price action. Look for peaks and valleys, and see how the price is moving overall.
Next, look at volume. Volume is important because it shows how popular the coin is. If the coin is unpopular, there will be low volume.
Finally, look at sentiment. Watch for changes in sentiment over time to get a better idea of how the market is behaving.
The ultimate guide to reading crypto charts
There is no one-size-fits-all answer to this question, as the best way to read crypto charts depends on the individual trader's strategy and preferences. However, here are a few tips that may help you get started:
1. Always keep an eye on the trend.
Most of the time, it's important to focus on the overall trend of the cryptocurrency market. This means evaluating how prices are moving over time, and whether there appears to be any significant changes or developments in the market.
2. Pay attention to volume.
Another important factor to consider when reading crypto charts is volume. This refers to the number of transactions that have occurred in the past 24 hours. If there are a lot of transactions taking place, this tends to indicate that there is strong interest in the particular cryptocurrency.
3. Watch for breakout moves.
If you see a cryptocurrency start to move significantly higher or lower than its previous price level, it may be worth considering buying in on the breakout move. This can be a risky move, but if the cryptocurrency continues to rally or drop after the breakout, it may be a good investment.
Your step-by-step guide to reading crypto charts
Cryptocurrency charts are a great way to understand and monitor the market conditions of a given digital asset.
There are a few things you need to keep in mind when reading crypto charts:
1. Look at the overall trend.
The first thing you want to look at is the overall trend of the asset. This will give you an idea of whether or not the asset is moving up or down.
2. Review the price and volume data.
Next, you want to review the price and volume data. This will give you an idea of how much investment interest there is in the asset, and how active the market is.
3. Check for indicators.
Finally, you should check for any indicators that may be indicating a change in the market conditions. This could include indicators like MACD, RSI, and Bollinger Bands.