Crypto Charts For Beginners
If you're new to the world of cryptocurrency, you may be feeling a bit overwhelmed. There are so many different coins, exchanges, and wallets out there, and it can be tough to keep track of everything. Luckily, there are some great resources available to help you get started. One of the most important things to understand is how to read crypto charts. In this article, we'll give you a crash course in chart reading for beginners. We'll cover the basics of what to look for in a chart, and how to interpret the most common types of data. With this knowledge, you'll be able to make more informed decisions about when to buy and sell your coins.
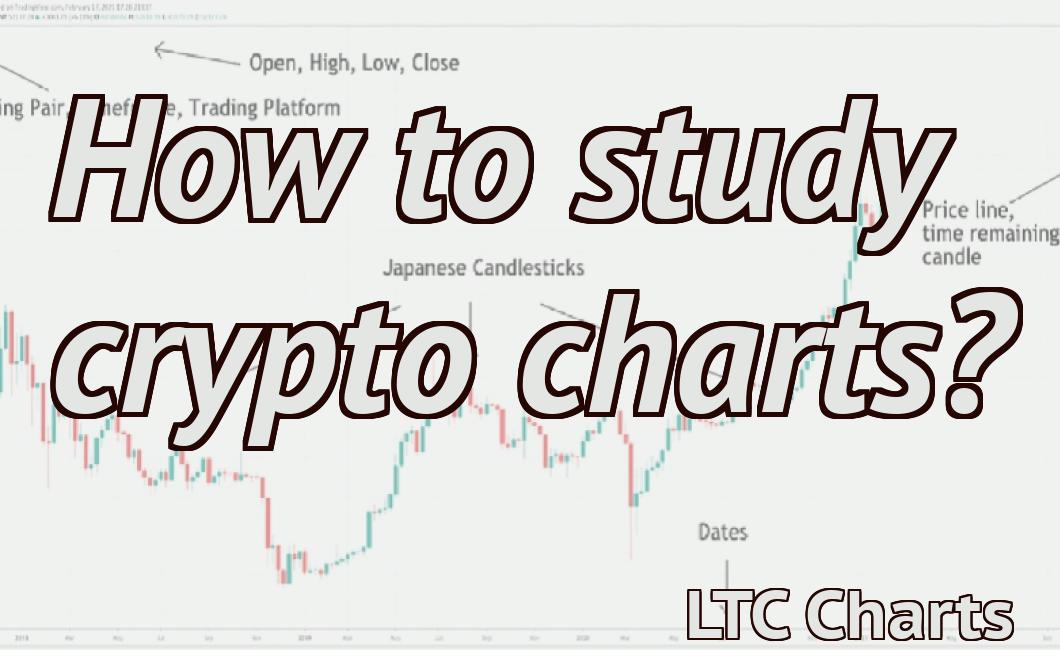
How to read crypto charts for beginners
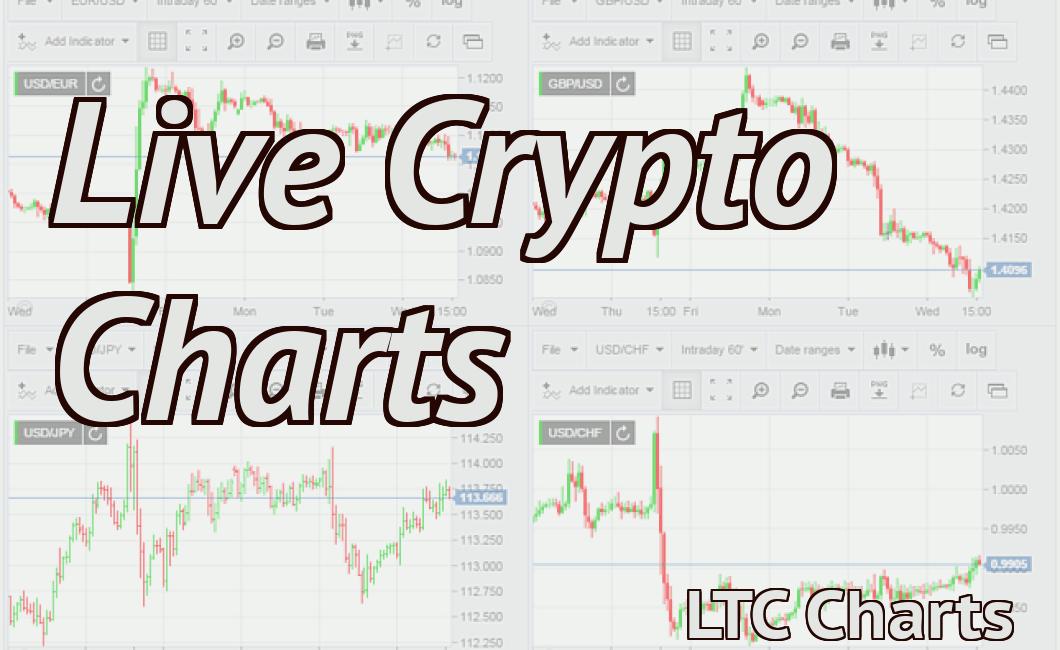
Crypto charts are a great way to track the performance of a cryptocurrency over time.
To read a crypto chart, you first need to find the currency you wish to track. To do this, type the currency's name into the search bar on CoinMarketCap.com.
Once you've found the currency, click on its image to view its live price chart.
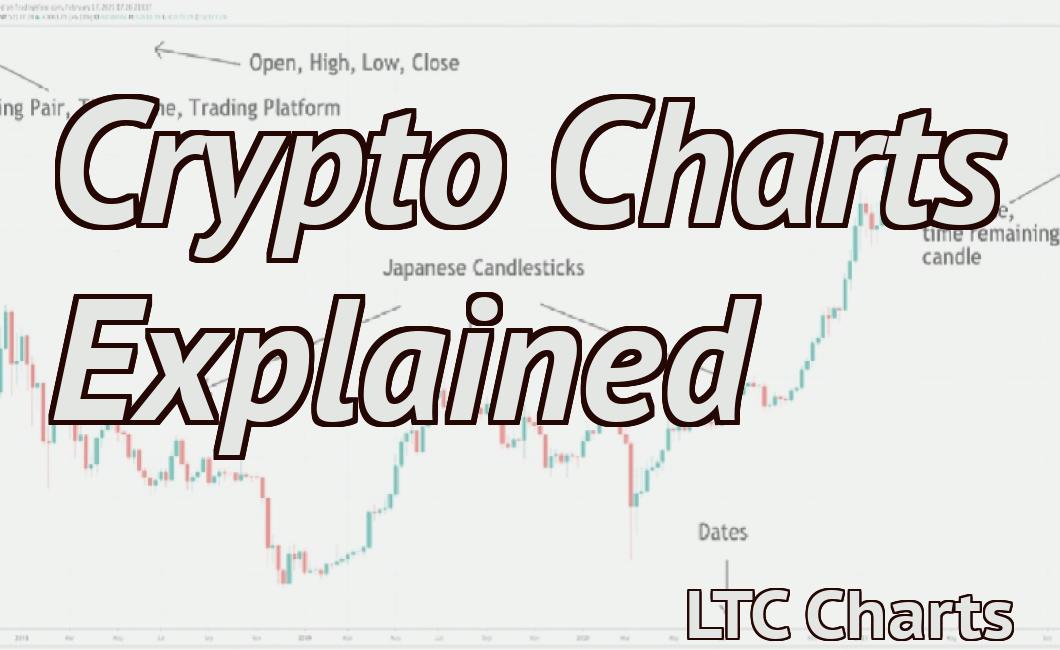
To understand what's happening on the chart, you'll need to understand some key terms. The first term is "price," which refers to the amount of money that a cryptocurrency is worth on the open market.
The second term is "volume." Volume measures how many coins have been traded in a given period of time. It's important to note that volume can be distorted by market manipulation (i.e. fake trading). That's why volume is often used in conjunction with other indicators to try and identify true market trends.
The third term is "supply and demand." Supply and demand determine how much of a given currency is available on the open market. When demand for a cryptocurrency is high, the price tends to go up. Conversely, when demand for a cryptocurrency is low, the price tends to go down.
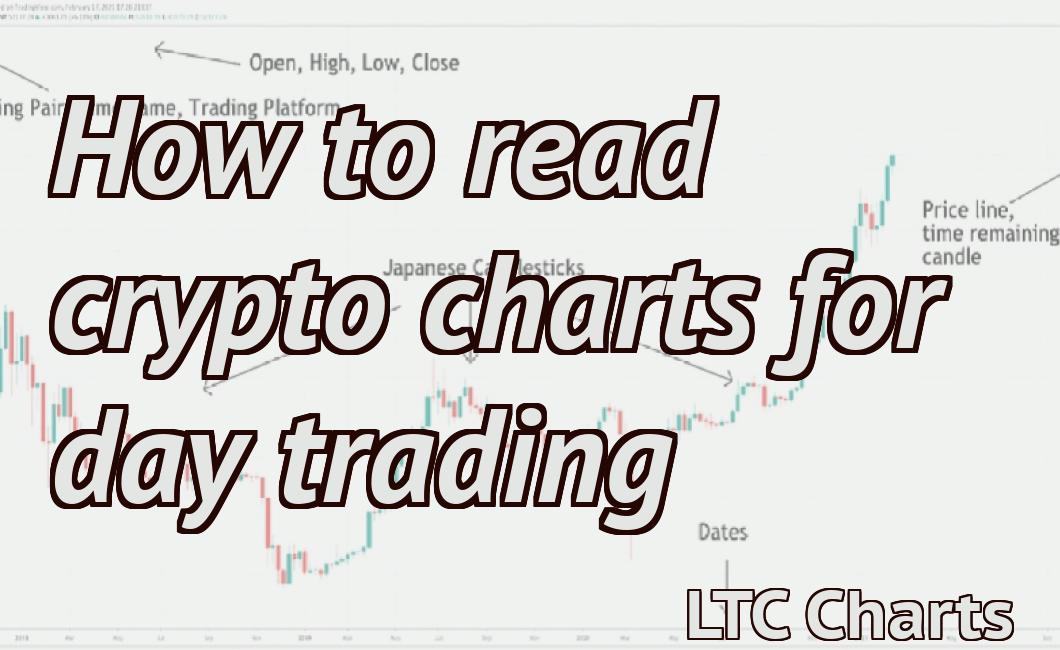
Finally, you'll need to understand some technical indicators. Technical indicators are mathematical formulas that are used to predict future trends in the market. Some common technical indicators used in cryptocurrency trading include the MACD (Moving Average Convergence Divergence), the RSI (Relative Strength Index), and the Bollinger Bands.
Once you've understood the basics of crypto trading, you're ready to start trading!
The most important crypto charts for beginners
Cryptocurrencies are complex and new technologies. So, it can be hard to understand what is happening with them.
That’s why we created this guide to help you understand the most important crypto charts for beginners.
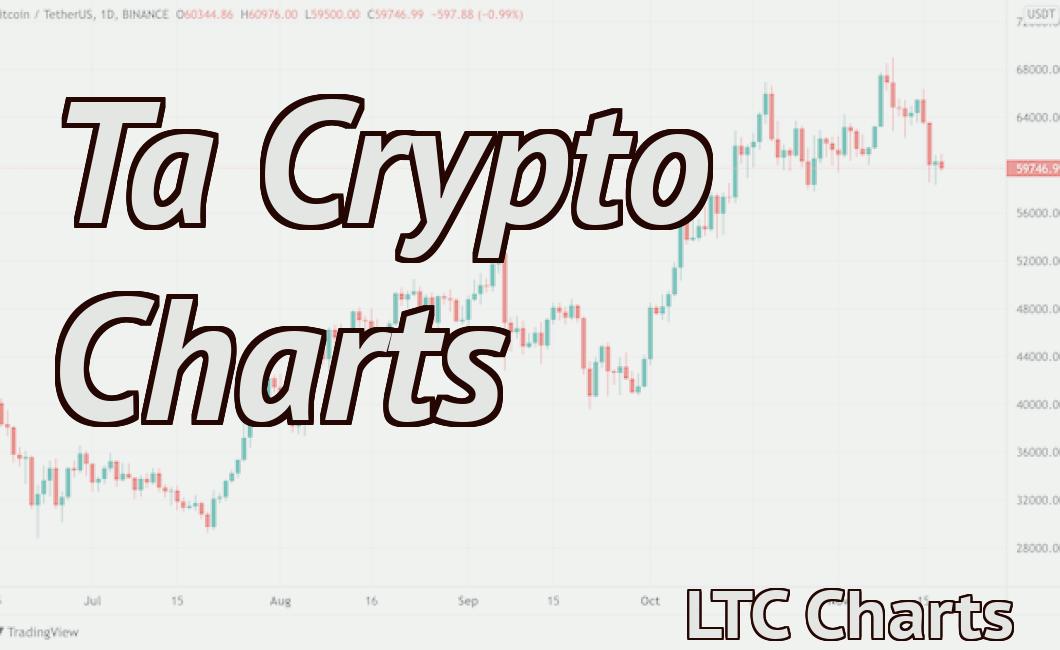
Cryptocurrency Price
This is the most important chart for beginners. It shows the price of a cryptocurrency over time.
This is a great way to understand how a cryptocurrency is performing.
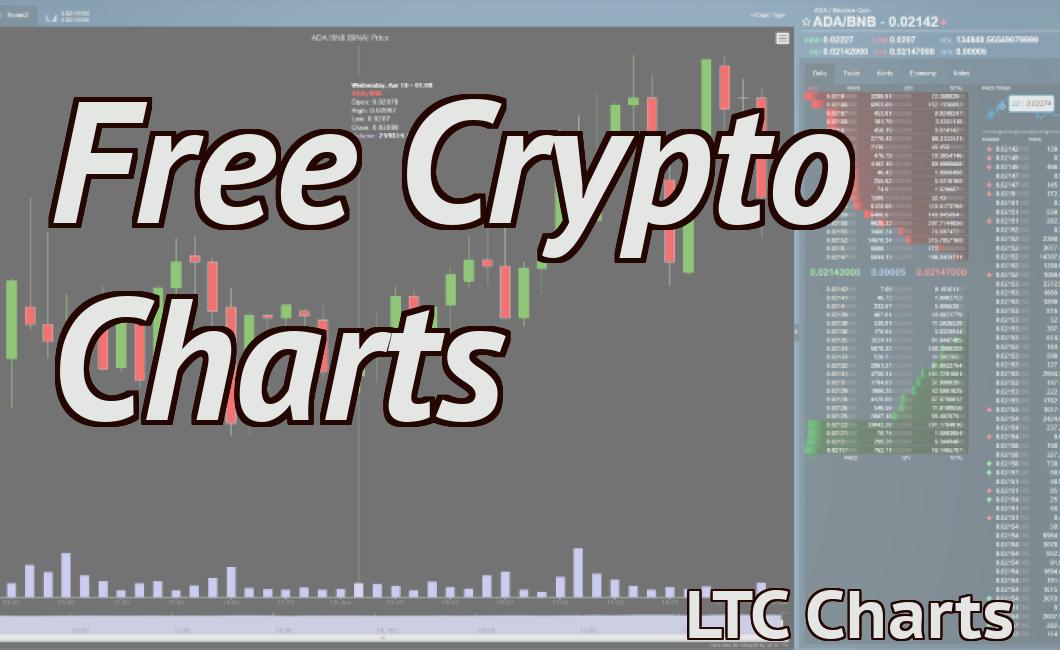
Cryptocurrency Volume
This is another important chart for beginners. It shows the total value of a cryptocurrency over time.
This is a great way to see how active the cryptocurrency market is.
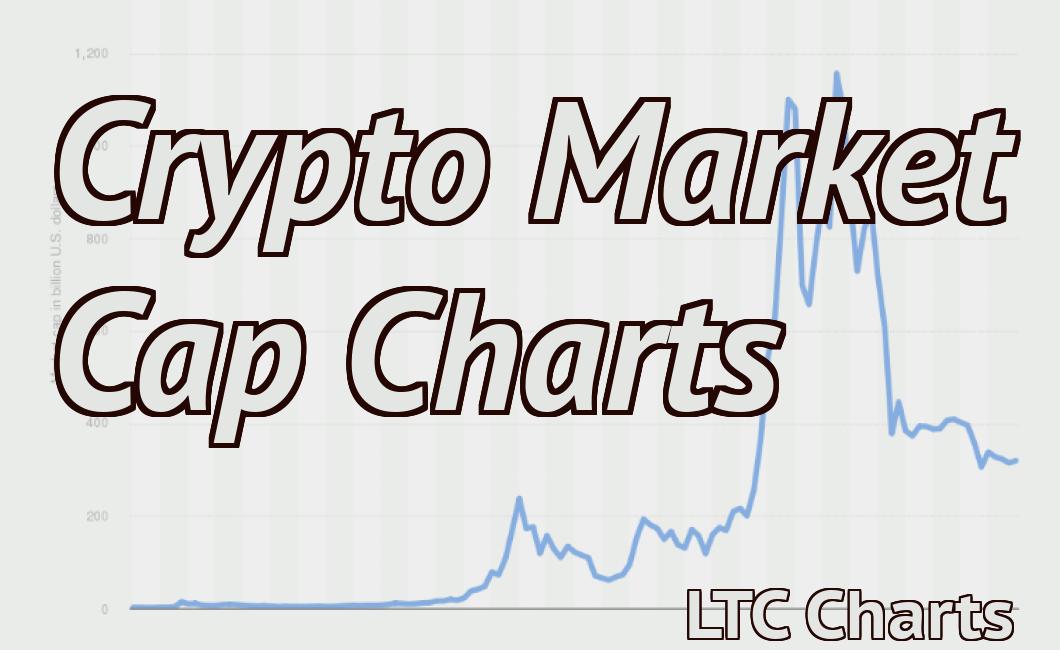
Cryptocurrency Market cap
This is the last important chart for beginners. It shows the value of a cryptocurrency overall.
This is a great way to see how valuable a cryptocurrency is.
The most popular crypto charts for beginners
CryptoCharts is a great resource for beginners who want to learn more about the different types of cryptocurrencies and how they work. The site has a wide variety of charts that cover almost every type of cryptocurrency out there.
CoinMarketCap is another great resource for beginners who want to learn about all the different cryptocurrencies and their prices. CoinMarketCap has a wide variety of charts that can show you the prices of different cryptocurrencies over time, as well as the market capitalization of all the different types of cryptocurrencies.
The best crypto charts for beginners
Cryptocurrencies are a relatively new asset class, and there is still much to learn about them. That said, there are some great crypto charts that can help beginners understand the basics of this new market.
1. CoinMarketCap
CoinMarketCap is one of the most popular crypto charts on the web. It provides real-time data on the price of cryptocurrencies across a variety of exchanges. This chart is useful for understanding the current state of the market, as well as tracking global trends.
2. CoinGecko
CoinGecko is another popular crypto chart. It provides data on the market capitalization of cryptocurrencies across a variety of exchanges. This chart is useful for tracking the overall growth of the market.
3. TradingView
TradingView is a popular platform for trading cryptocurrencies. It provides comprehensive charts and data on the price of cryptocurrencies across a variety of exchanges. This chart is ideal for more advanced traders who want to track specific markets.
4. CoinMarketCap (Alt)
CoinMarketCap (Alt) provides alternative data on the price of cryptocurrencies across a variety of exchanges. This chart is useful for tracking global trends that may not be available on the main CoinMarketCap page.
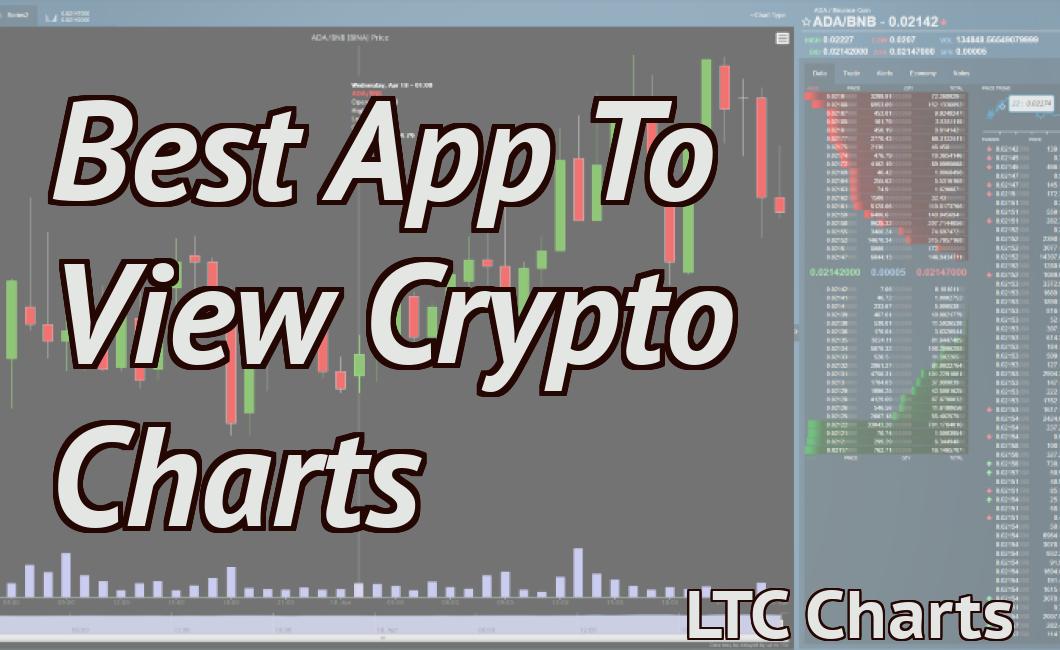
How to use crypto charts for beginners
Cryptocurrencies are digital or virtual tokens that use cryptography to secure their transactions and to control the creation of new units. Bitcoin, the first and most well-known cryptocurrency, was created in 2009. Cryptocurrencies are decentralized, meaning they are not subject to government or financial institution control.
To use crypto charts for beginners, first find a cryptocurrency you want to learn more about. Once you have found a cryptocurrency, open a web browser and visit a cryptocurrency website, such as CoinMarketCap.com. On this website, you will see a list of all the available cryptocurrencies. Scroll down the list and find the cryptocurrency you are interested in. Click on the name of the cryptocurrency to open its website.
On the cryptocurrency website, you will see a list of all the available coins and tokens. On this list, you will see a series of charts that show the price history of the cryptocurrency. The first chart will show the price history of the cryptocurrency over the past 24 hours. The second chart will show the price history of the cryptocurrency over the past 7 days. The third chart will show the price history of the cryptocurrency over the past 30 days. The fourth chart will show the price history of the cryptocurrency over the past 60 days. The fifth chart will show the price history of the cryptocurrency over the past 365 days.
The sixth chart will show the price history of the cryptocurrency over the past year. The seventh chart will show the price history of the cryptocurrency over the past 5 years. The eighth chart will show the price history of the cryptocurrency over the past 10 years. The ninth chart will show the price history of the cryptocurrency over the past all time.
On this website, you can also view detailed information about each cryptocurrency, including its name, symbol, launch date, market cap, and total supply. You can also view information about the team behind the cryptocurrency, such as their website and social media profiles.
Once you have found a cryptocurrency you are interested in, click on the chart to view its details. On this page, you will see information about the current price of the cryptocurrency, as well as information about its recent price history. You can also view information about the total supply of the cryptocurrency, as well as information about the circulating supply of the cryptocurrency.
If you want to buy or sell cryptocurrencies, you can visit a cryptocurrency exchange website, such as Binance.com or Coinbase.com. On these websites, you will be able to buy or sell cryptocurrencies using traditional currency, such as US dollars or euros.
What crypto charts for beginners need to know
Cryptocurrencies are digital or virtual tokens that use cryptography to secure their transactions and to control the creation of new units. Cryptocurrencies are decentralized, meaning they are not subject to government or financial institution control. Bitcoin, the first and most well-known cryptocurrency, was created in 2009. Cryptocurrencies are often traded on decentralized exchanges and can also be used to purchase goods and services.