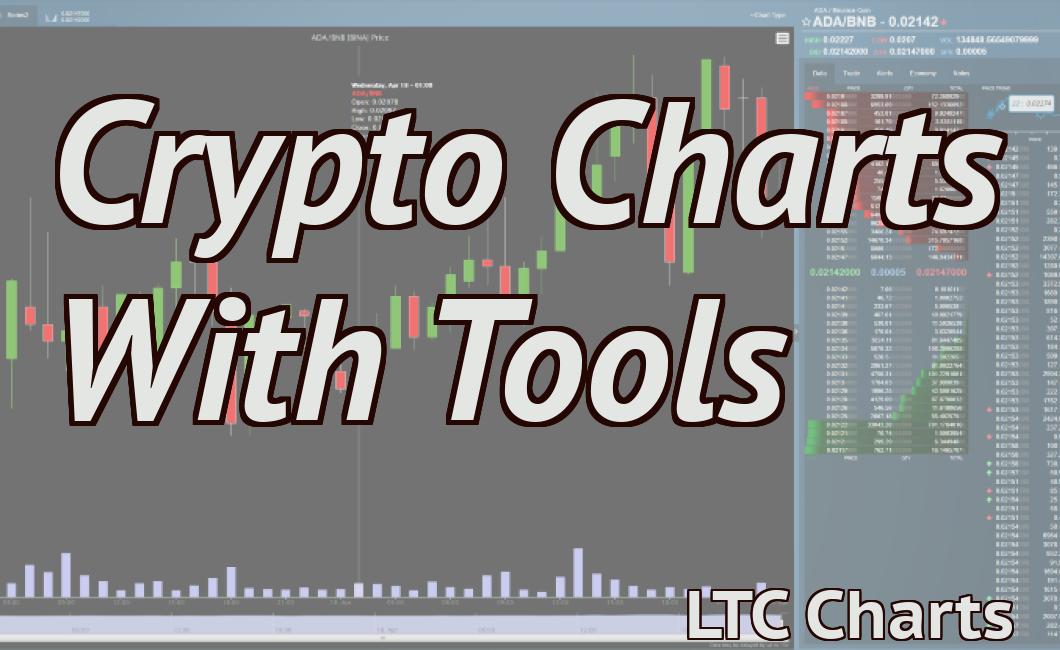
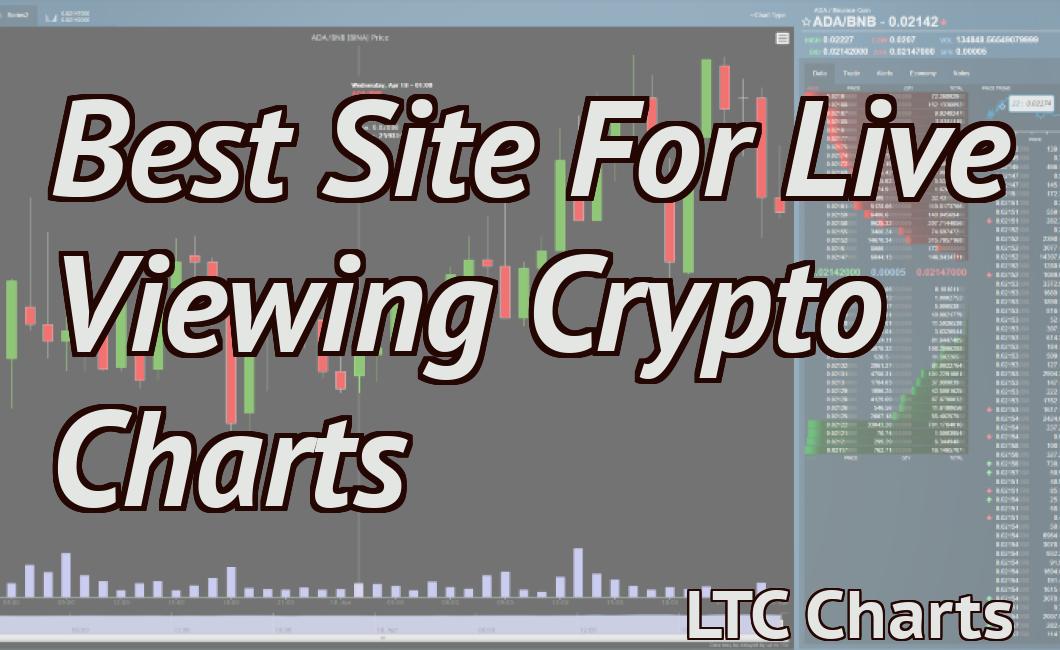
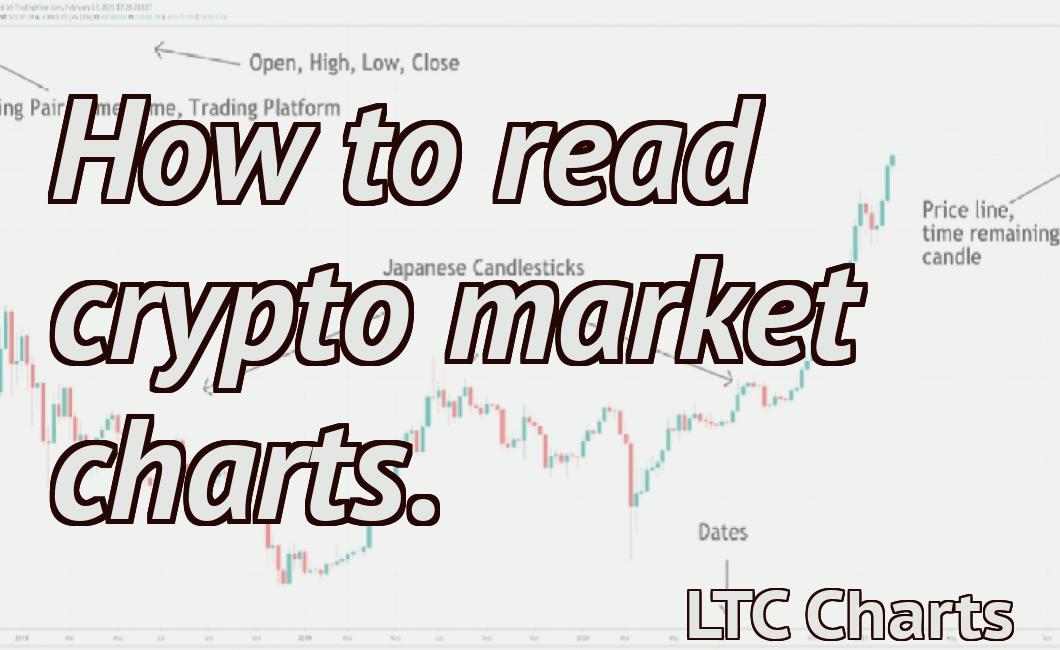
How to read and analyze crypto price charts.
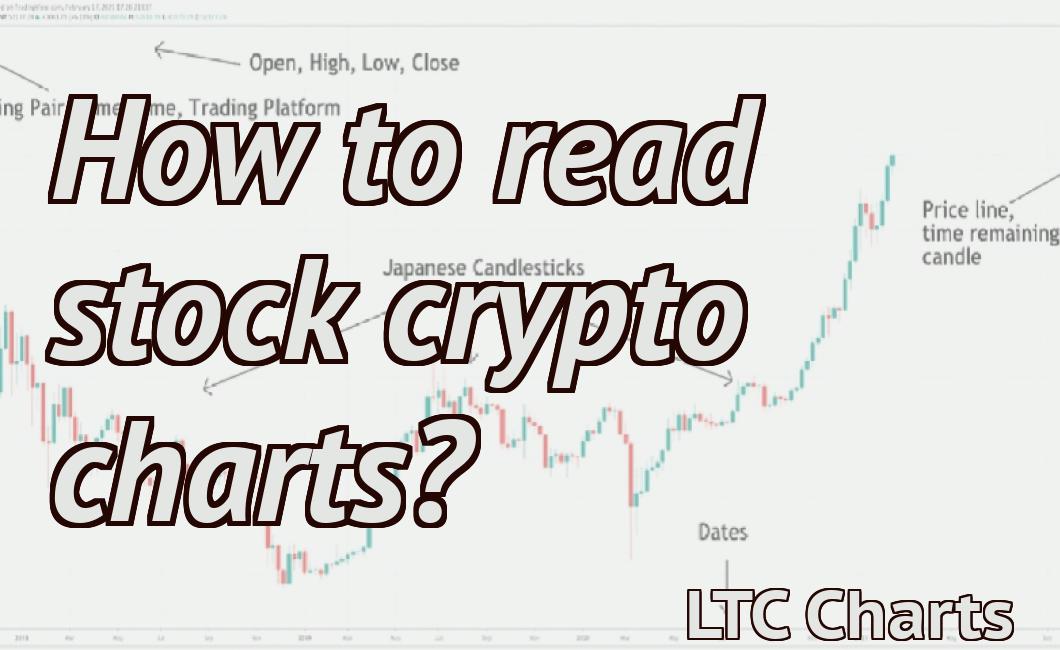
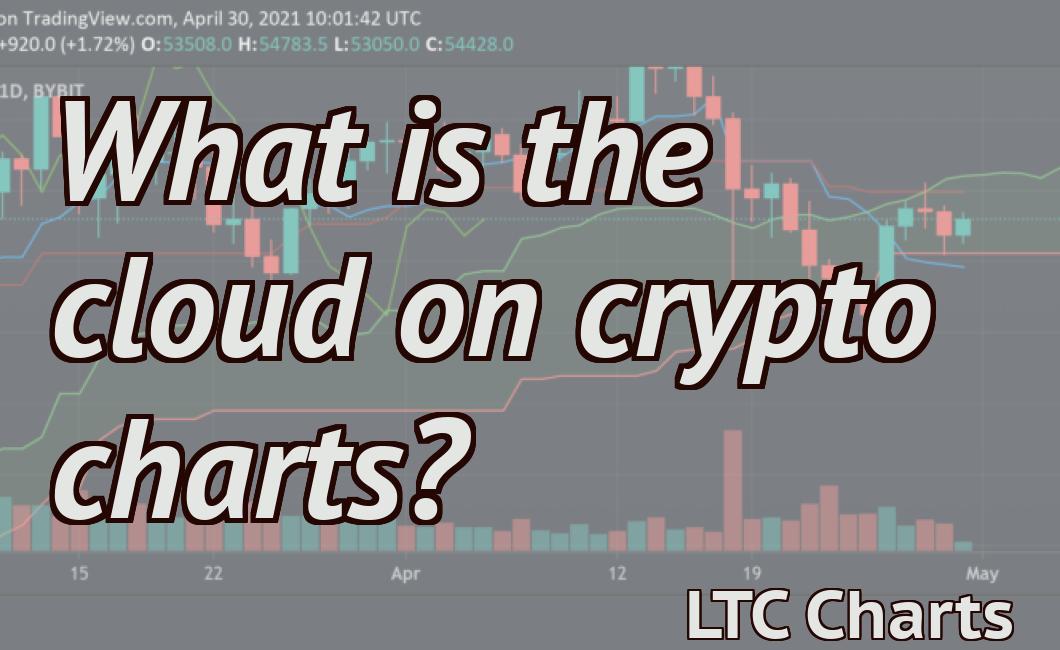
If you're new to the world of cryptocurrency, you may be wondering how to read and analyze crypto price charts. While it may seem daunting at first, it's actually not that difficult once you know what you're looking for. Here's a quick guide on how to read and analyze crypto price charts. The first thing you'll notice on a crypto price chart is the candlestick formation. Each candlestick represents a specific time period, and the formation can give you valuable insights into the market sentiment during that time. For example, a long green candlestick indicates strong buying pressure, while a long red candlestick indicates strong selling pressure. You'll also notice various indicators on crypto price charts. These indicators can help you identify trends, support and resistance levels, and potential reversals. Some popular indicators include moving averages, Bollinger Bands, and RSI (relative strength index). Once you know how to read and interpret crypto price charts, you'll be able to make more informed decisions when trading or investing in cryptocurrencies.
How to Read and Analyze Crypto Price Charts
Crypto price charts are a great way to track the performance of different cryptocurrencies.
The first step is to identify the cryptocurrency you are interested in. Once you have identified the cryptocurrency, you can then look for the correct price chart.
Cryptocurrency price charts are usually displayed in a number of different formats, including candles, trend lines, and bar charts.
To read a crypto price chart, start by identifying the timeframe you are interested in. For example, you may want to look at cryptocurrency price charts for a day, a week, or a month.
Once you have identified the timeframe, you can start to look at the different indicators on the chart.
Some common indicators to look for include:
The price of the cryptocurrency
The volume of the cryptocurrency
The market cap of the cryptocurrency
The number of active buyers and sellers of the cryptocurrency
The price of the cryptocurrency over time
The price of the cryptocurrency compared to other cryptocurrencies
Once you have identified the indicators on the chart, you can start to analyze the data.
One common analysis technique is to look at the trend line. You can use the trend line to determine if the cryptocurrency is trending up or down.
You can also use the trend line to determine when the cryptocurrency is likely to reach a certain price point.
Another common analysis technique is to look at the candles. You can use the candles to determine if the cryptocurrency is gaining or losing value over time.
You can also use the candles to determine when the cryptocurrency is likely to reach a certain price point.
Finally, you can also look at the bar chart to see how many units of the cryptocurrency have been sold over a certain period of time.
How to Use Crypto Price Charts to Your Advantage
Crypto price charts are a great way to monitor the market and make informed decisions. By understanding where prices are currently and where they have been in the past, you can better predict where they are likely to go in the future.
There are a few things to keep in mind when using crypto price charts:
1. Always use caution when making investment decisions.
2. Always consult a financial advisor before making any changes to your financial plan.
3. Always be aware of potential risks associated with cryptocurrency trading.
4. Always remember that crypto prices are highly volatile and can quickly change.
Here are a few tips for using crypto price charts to your advantage:
1. Use crypto price charts to monitor short-term changes in the market.
2. Use crypto price charts to track long-term trends.
3. Use crypto price charts to make informed investment decisions.
4. Use crypto price charts to stay up to date on the latest market trends.
The Benefits of Reading Crypto Price Charts
There are a number of benefits to reading crypto price charts.
1. Tracking Price Trends
One of the main benefits of reading crypto price charts is tracking price trends. By monitoring the movement of prices over time, you can gain a better understanding of how the market is performing and what factors are influencing it. This information can help you make informed decisions when trading cryptocurrencies.
2. Learning About Cryptocurrencies
Another benefit of reading crypto price charts is learning about cryptocurrencies. By monitoring the prices of different cryptocurrencies, you can gain a better understanding of their strengths and weaknesses. This information can help you make informed decisions when investing in these assets.
3. Predicting Future Trends
By understanding past trends, you can better predict future trends in the cryptocurrency market. This information can help you make informed decisions when investing in these assets.
4. Identifying Opportunities
By identifying opportunities in the cryptocurrency market, you can gain an advantage over other investors. This information can help you make profitable investments in the market.
How to Make the Most Out of Crypto Price Charts
Crypto price charts can be a helpful tool for understanding the current state of the crypto market.
When looking at crypto price charts, it is important to keep in mind the following four tips:
1. Compare the prices of different cryptocurrencies.
2. Compare the prices of different time periods.
3. Compare the prices of different exchanges.
4. Compare the prices of different markets.
1. Compare the prices of different cryptocurrencies.
When looking at crypto price charts, it is important to compare the prices of different cryptocurrencies. This allows you to understand which cryptocurrencies are experiencing the most growth or decline.
2. Compare the prices of different time periods.
When looking at crypto price charts, it is useful to compare the prices of different time periods. This allows you to see how the crypto market has responded to different events.
3. Compare the prices of different exchanges.
When looking at crypto price charts, it is important to compare the prices of different exchanges. This allows you to see which exchanges are providing the best value for your money.
4. Compare the prices of different markets.
When looking at crypto price charts, it is important to compare the prices of different markets. This allows you to understand which market is experiencing the most growth or decline.
How to Get the Most Out of Crypto Price Charts
There are many ways to get the most out of crypto price charts. Here are a few tips:
1. Use a Crypto Price Charting Tool
One of the best ways to get the most out of crypto price charts is to use a crypto price charting tool. These tools allow you to see the latest prices for cryptocurrencies and other digital assets, as well as detailed historical data.
2. Compare Prices
One of the best ways to get the most out of crypto price charts is to compare prices. This will allow you to see how prices have changed over time and which cryptocurrencies are performing the best.
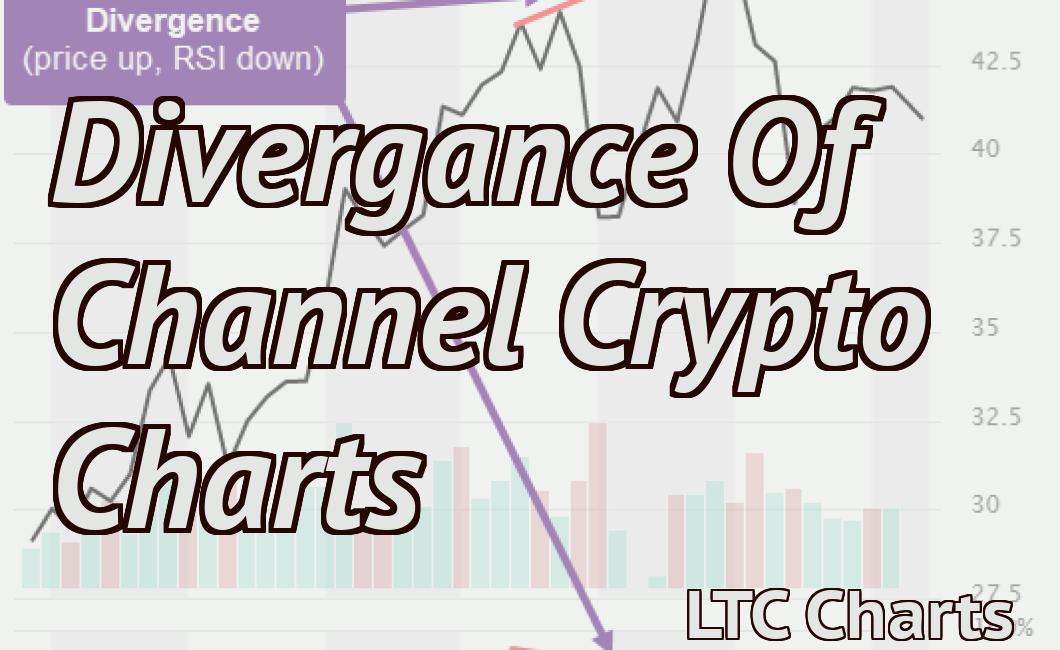
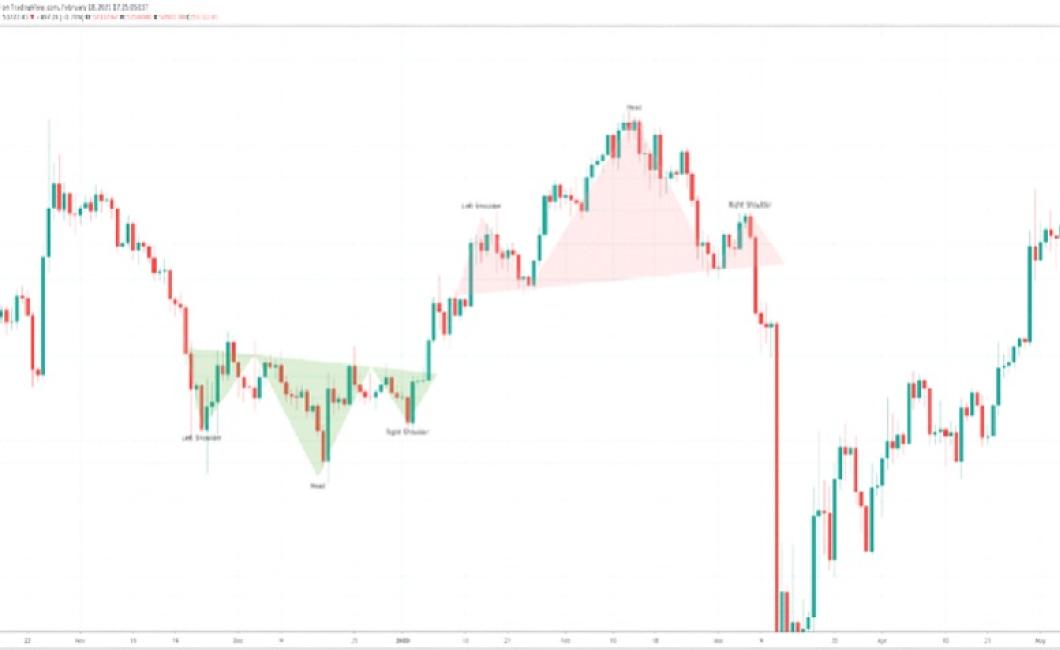
3. Watch for Patterns
Another way to get the most out of crypto price charts is to watch for patterns. This will help you identify trends and patterns in the cryptocurrency market.
4. Get notified about Price Changes
One of the best ways to get the most out of crypto price charts is to be notified about price changes. This will allow you to stay up to date on the latest prices and movements in the cryptocurrency market.
How to take Advantage of Crypto Price Charts
The first step to taking advantage of crypto price charts is to understand what they are and how they work. Crypto price charts are visual representations of the prices of digital currencies over time. They can be used to track the performance of individual cryptocurrencies or entire markets.
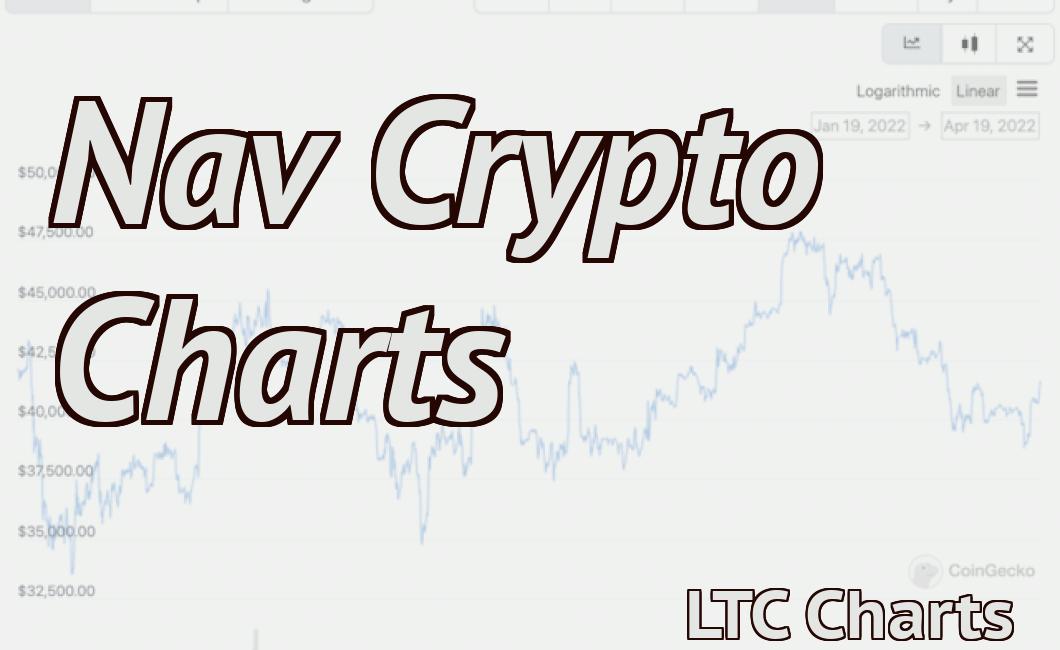
To use crypto price charts, you first need to find a reputable website that offers them. Some of the most popular options include CoinMarketCap and CoinGecko. Once you have found a chart, you need to understand the different indicators that are used to display prices.
Some of the most common indicators used on crypto price charts are the candles, lines, and volumes. Candles are used to show the opening and closing prices of a market. Lines indicate the movement of prices over time and can be used to identify trends. Volumes indicate how many transactions have been made in a given period.
Once you have an understanding of the different indicators used on crypto price charts, you can start to take advantage of their information. For example, you can track the performance of individual cryptocurrencies by looking at their candles and volumes. You can also identify trends by looking at lines and candle patterns.
How to Exploit Crypto Price Charts
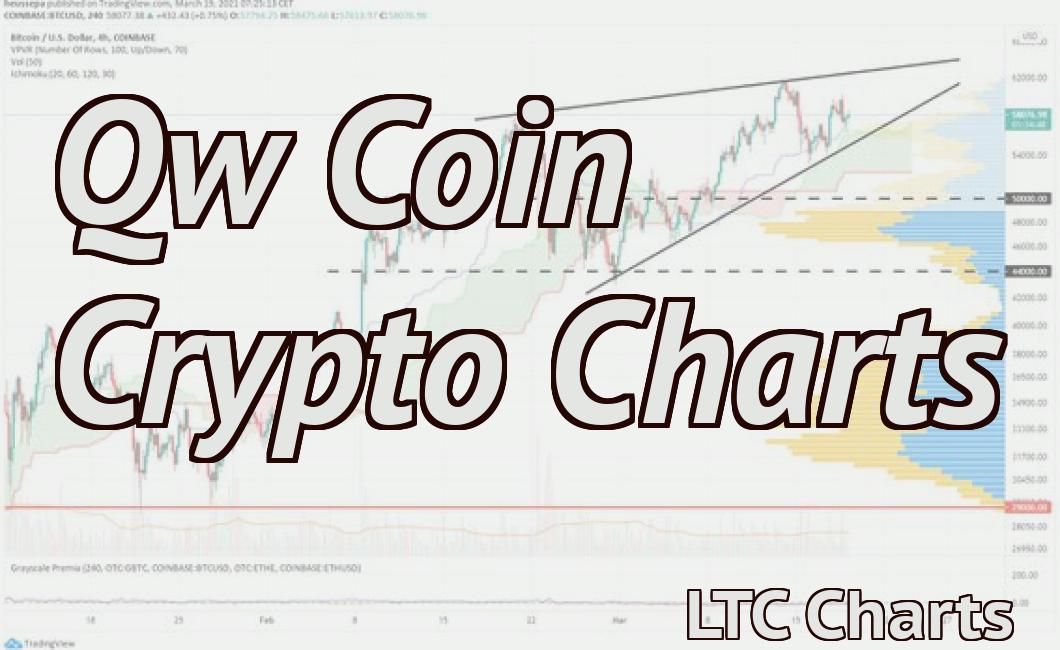
The first step to exploiting crypto price charts is understanding how they work. A crypto price chart is a graphical representation of the price of a cryptocurrency over time. The chart typically displays the price of a cryptocurrency over a period of 24 hours, 7 days, or 30 days.
Crypto price charts can be divided into two main types: moving average and candlestick charts.
Moving average charts use a simple calculation to smooth out the volatility of cryptocurrency prices. The calculation uses a moving average, which is a mathematical average of a set of data points. The moving average helps to smooth out sudden changes in price and provides a more accurate overall picture of the trend.
Candlestick charts are popular among day traders. Candlestick charts display the price of a cryptocurrency over a specific period of time using a series of colored candlesticks. Each candlestick represents a 1-minute interval and the color indicates the price direction: green for up, red for down, and white for unchanged.
Crypto price charts can be used to identify opportunities for investment or to track the progress of a cryptocurrency portfolio. They can also be used to forecast future price movements.
To exploit crypto price charts, it is important to understand how they work. Once you understand how a crypto price chart works, you can use that information to your advantage.
How to Use Crypto Price Charts for Maximum Profit
Crypto price charts offer a great way to stay up-to-date on the latest cryptocurrency prices, and to make informed investment decisions.
Here are four tips for using crypto price charts to your advantage:
1. Compare different coins regularly.
When you’re looking at a crypto price chart, it’s important to compare different coins regularly. This will help you identify which coins are actually experiencing price growth, and which coins may be headed for a decline.
2. Watch for trends.
When you’re looking at a crypto price chart, it’s important to watch for any trends. This will help you identify which coins are experiencing significant price growth, or price declines.
3. Look for signals.
When you’re looking at a crypto price chart, it’s important to look for signals. This will help you identify when a coin is about to experience significant price growth, or when it may experience a price decline.
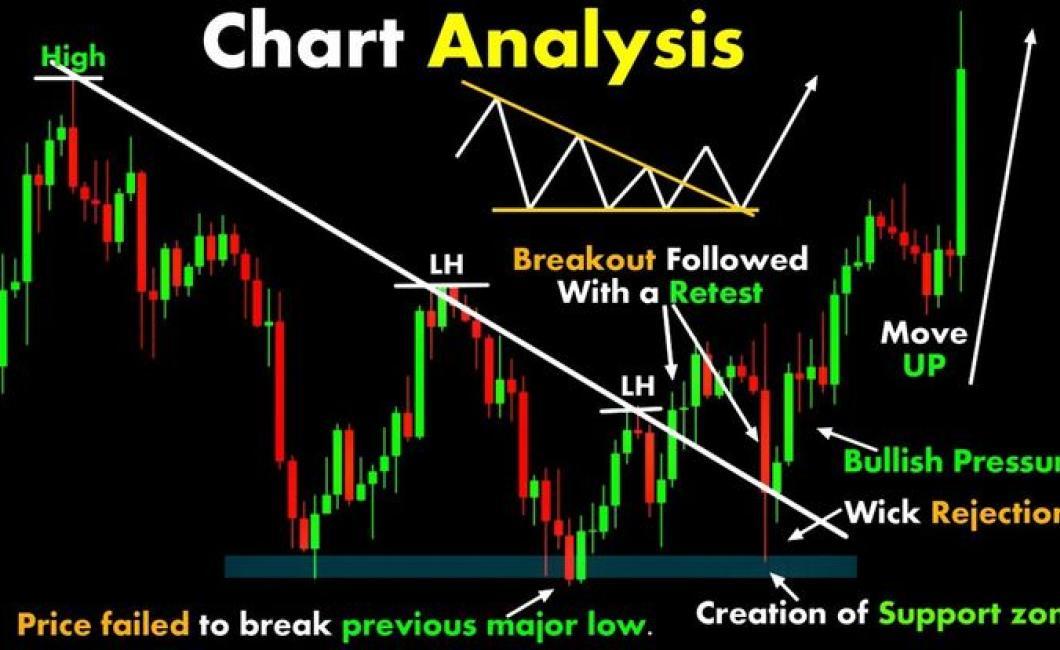
4. Use technical analysis to your advantage.
When you’re looking at a crypto price chart, it’s important to use technical analysis to your advantage. This will help you identify when a coin is about to experience significant price growth, or when it may experience a price decline.
How to Use Crypto Price Charts for Long-Term Success
Crypto Price Charts can be used to track the value of cryptocurrencies over time. By doing this, you can ensure that you are making the most informed decisions when investing in these assets.
Below are a few tips on how to use Crypto Price Charts effectively:
1. Always start with a basic understanding of what a cryptocurrency is and how it works. This will help you to understand the charts better and make more informed investment decisions.
2. Compare the prices of different cryptocurrencies over time. This will help you to identify which ones are performing the best.
3. Use a Crypto Price Chart as a guide for your investments. Always do your own research before investing in any cryptocurrency.
How to Use Crypto Price Charts for Beginner Traders
Cryptocurrency price charts are a great way for beginner traders to understand how the prices of different cryptocurrencies are moving over time.
To use a cryptocurrency price chart, first find the cryptocurrency you want to track. To find the current price of a particular cryptocurrency, go to CoinMarketCap and type in the name of the cryptocurrency you want to track.
Once you have found the cryptocurrency price chart, you will need to find the specific date you want to view. To do this, click on the “Today’s Price” link on the left-hand side of the chart. This will take you to a page where you can select the date you want to view.
Finally, you will need to find the “ candles ” that represent the prices of the cryptocurrencies you are tracking. To do this, click on the “ candles ” link on the left-hand side of the chart. This will take you to a page where you can see all of the candles that have been traded for that cryptocurrency during that specific time period.